Open Access
Fig. 11
Download original image
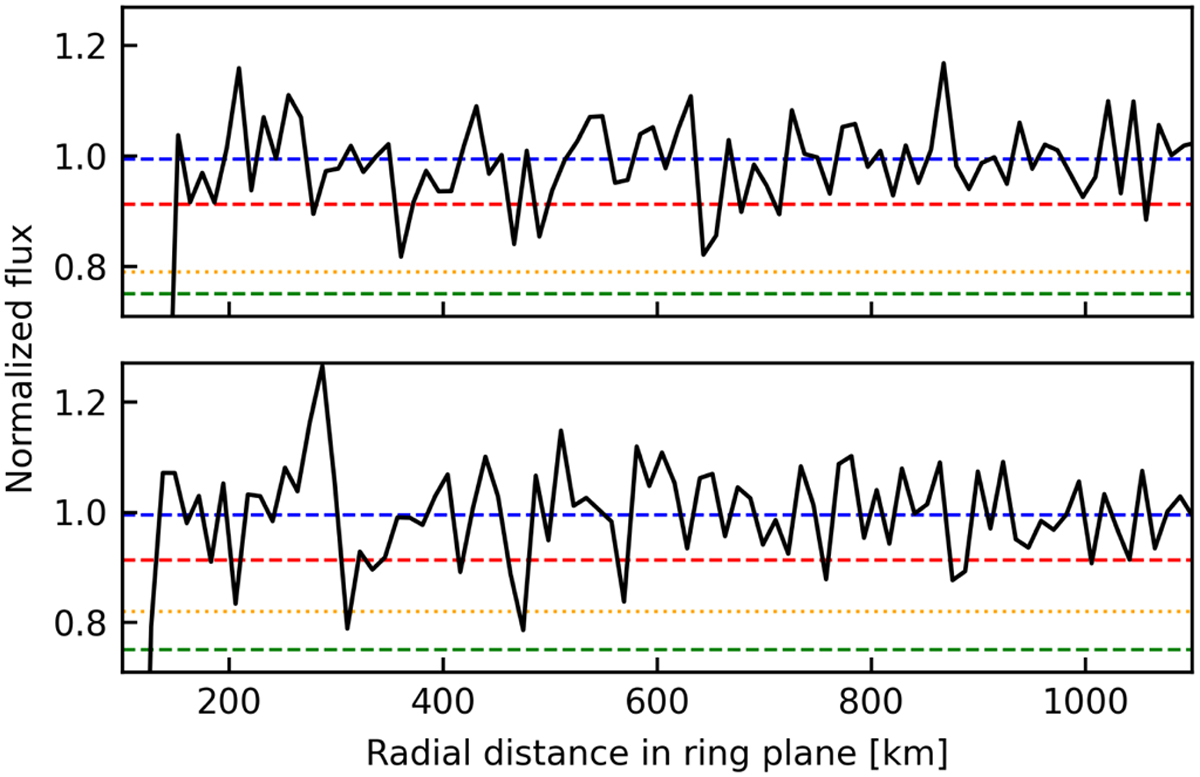
Light curve of the flux versus the distance to Chiron’s center in the ring plane. The dashed lines in red and green correspond to the detection limits at the 1 and 3σ levels, respectively. The yellow dotted line corresponds to the expected depth of the occultation promoted by the proposed rings.
Current usage metrics show cumulative count of Article Views (full-text article views including HTML views, PDF and ePub downloads, according to the available data) and Abstracts Views on Vision4Press platform.
Data correspond to usage on the plateform after 2015. The current usage metrics is available 48-96 hours after online publication and is updated daily on week days.
Initial download of the metrics may take a while.