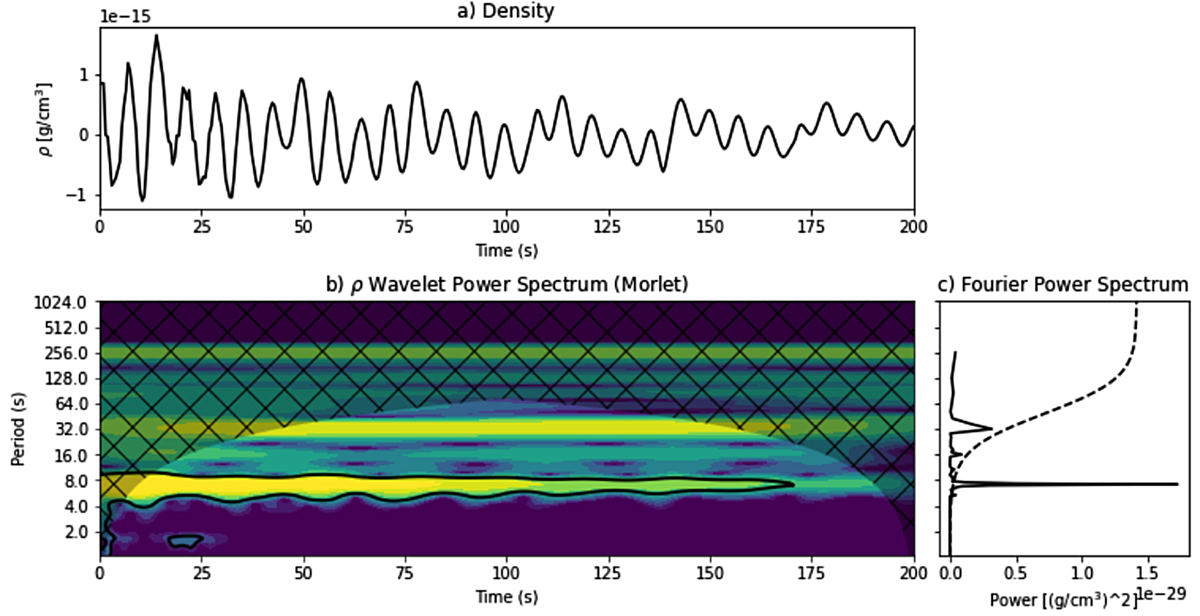
Fig. 2.
Download original image
Density wavelet analysis. (a) Density along time measured at the central pixel of the B20 case. (b) Wavelet power spectrum. The black cross-lines show the part of the spectrum that is inside the cone of influence. The dominant period of ∼7 s is enclosed by the black contours with a 99% confidence level. (c) Fourier power spectrum (solid line) and the 99% confidence spectrum (dashed line).
Current usage metrics show cumulative count of Article Views (full-text article views including HTML views, PDF and ePub downloads, according to the available data) and Abstracts Views on Vision4Press platform.
Data correspond to usage on the plateform after 2015. The current usage metrics is available 48-96 hours after online publication and is updated daily on week days.
Initial download of the metrics may take a while.