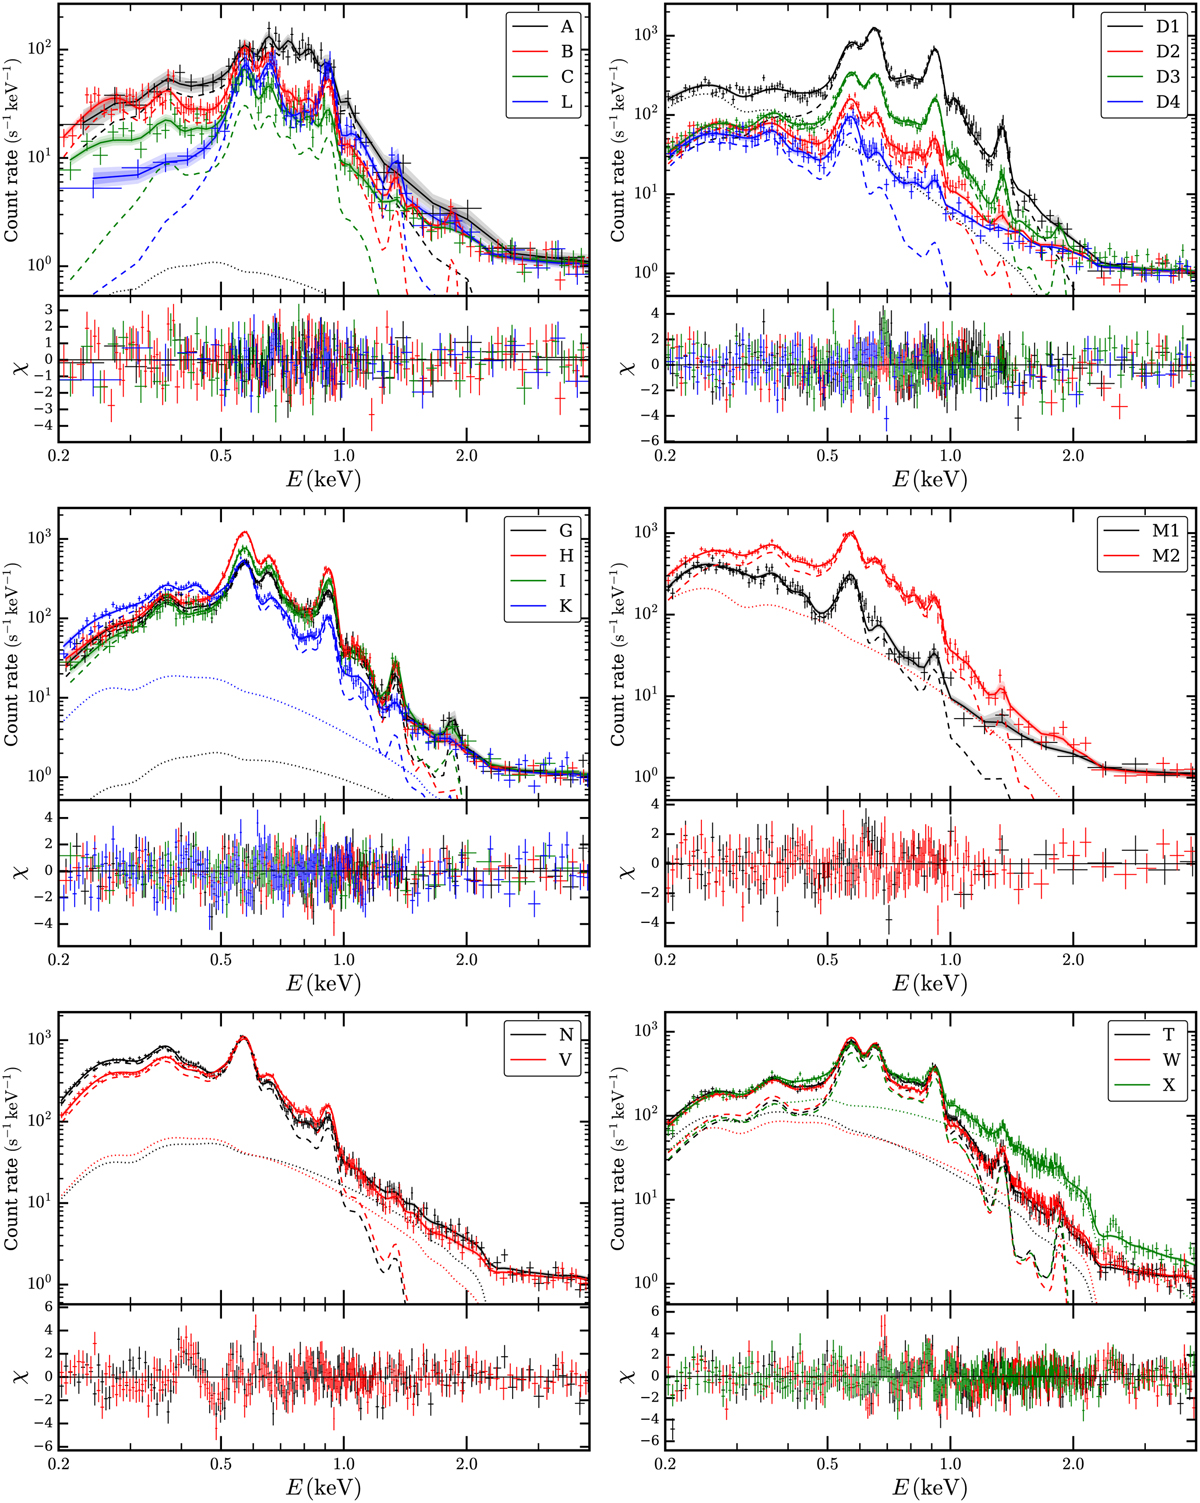
Fig. 8
Download original image
Spectra of prominent morphological features of Vela. The extraction regions of all spectra are outlined in Fig. 7 and identified according to their assigned labels in the figure legends. For all panels, we display the results of the TNT spectral model, which in a few cases gave considerably better fits than the 2TNT model. In each subplot, the displayed spectral model corresponds to the median of the prediction obtained from the posterior sample of our MCMC procedure. The dashed (dotted) line represents the median contribution from the thermal (nonthermal) source model component. For the sake of comparability, all spectra and models have been normalized dividing by their BACKSCAL keyword, resulting in equal levels of particle background.
Current usage metrics show cumulative count of Article Views (full-text article views including HTML views, PDF and ePub downloads, according to the available data) and Abstracts Views on Vision4Press platform.
Data correspond to usage on the plateform after 2015. The current usage metrics is available 48-96 hours after online publication and is updated daily on week days.
Initial download of the metrics may take a while.