Fig. 7
Download original image
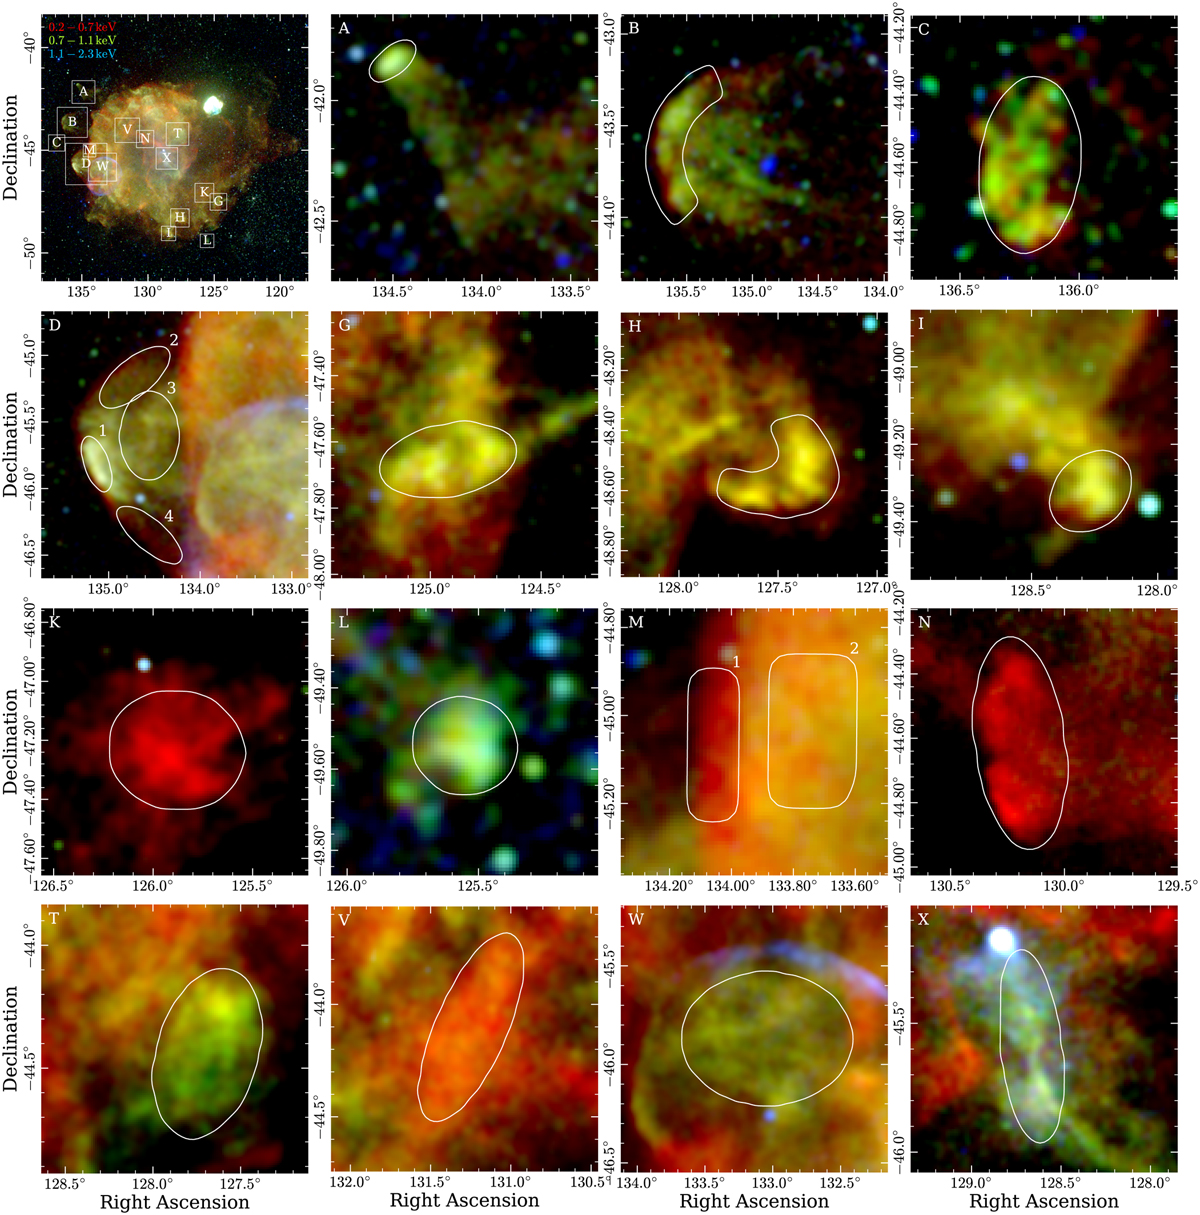
Morphological features of Vela. The upper left panel displays the false-color image of Vela shown in Fig. 1, with white boxes outlining the regions depicted by each of the other panels, which are identified with the corresponding letter. The brightness scale used in each subpanel preserves the relative colors of the original image, via a truncation of the original brightness scale at equal quantiles for the soft, medium, and hard bands, with the goal of optimally displaying the morphology of the features. In each panel, we indicate the regions used for extraction of the spectra shown in Fig. 8 in white, with numbers distinguishing the individual spectra in case of multiple regions.
Current usage metrics show cumulative count of Article Views (full-text article views including HTML views, PDF and ePub downloads, according to the available data) and Abstracts Views on Vision4Press platform.
Data correspond to usage on the plateform after 2015. The current usage metrics is available 48-96 hours after online publication and is updated daily on week days.
Initial download of the metrics may take a while.