Fig. 5
Download original image
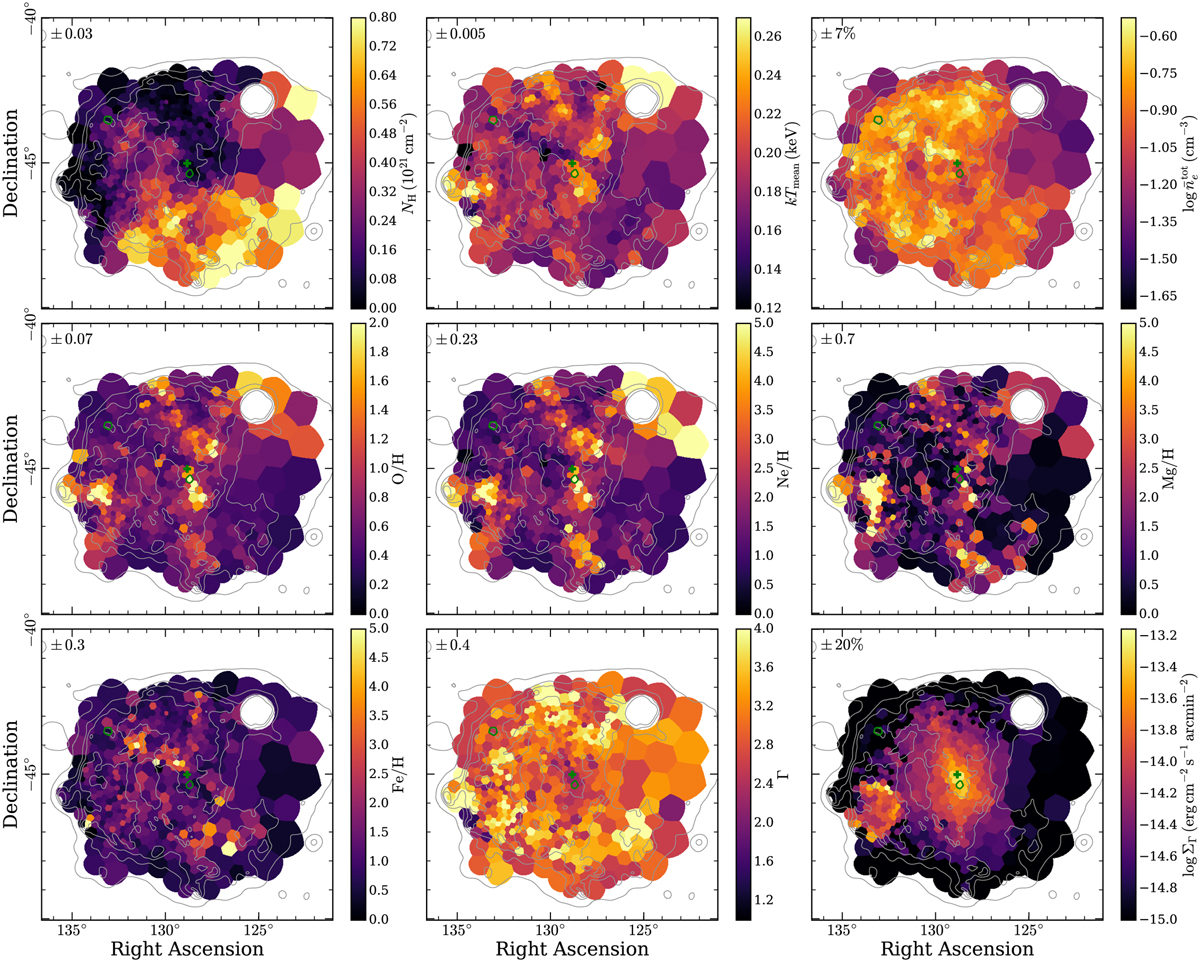
Parameter maps from spatially resolved spectroscopy of Vela, using the 2TNT model. We display the distribution of the following physical quantities: absorption column density NH, mean temperature kTmean, total electron density ![]() , relative abundances of O, Ne, Mg, Fe, normalized to solar values, of the thermal components, as well as spectral index Г and surface brightness ΣГ in the 1.0–5.0 keV range of the nonthermal component. To provide a rough estimate of the typical noise level, the upper left corner of each panel indicates the median uncertainty for the respective parameter across all bins. The gray contours reflect the broad-band count rate of Vela, and are identical to those displayed in Fig. 1. The green polygons mark the two regions whose spectra are displayed in Fig. 4, and the green + sign marks the position of the Vela pulsar.
, relative abundances of O, Ne, Mg, Fe, normalized to solar values, of the thermal components, as well as spectral index Г and surface brightness ΣГ in the 1.0–5.0 keV range of the nonthermal component. To provide a rough estimate of the typical noise level, the upper left corner of each panel indicates the median uncertainty for the respective parameter across all bins. The gray contours reflect the broad-band count rate of Vela, and are identical to those displayed in Fig. 1. The green polygons mark the two regions whose spectra are displayed in Fig. 4, and the green + sign marks the position of the Vela pulsar.
Current usage metrics show cumulative count of Article Views (full-text article views including HTML views, PDF and ePub downloads, according to the available data) and Abstracts Views on Vision4Press platform.
Data correspond to usage on the plateform after 2015. The current usage metrics is available 48-96 hours after online publication and is updated daily on week days.
Initial download of the metrics may take a while.