Fig. 4
Download original image
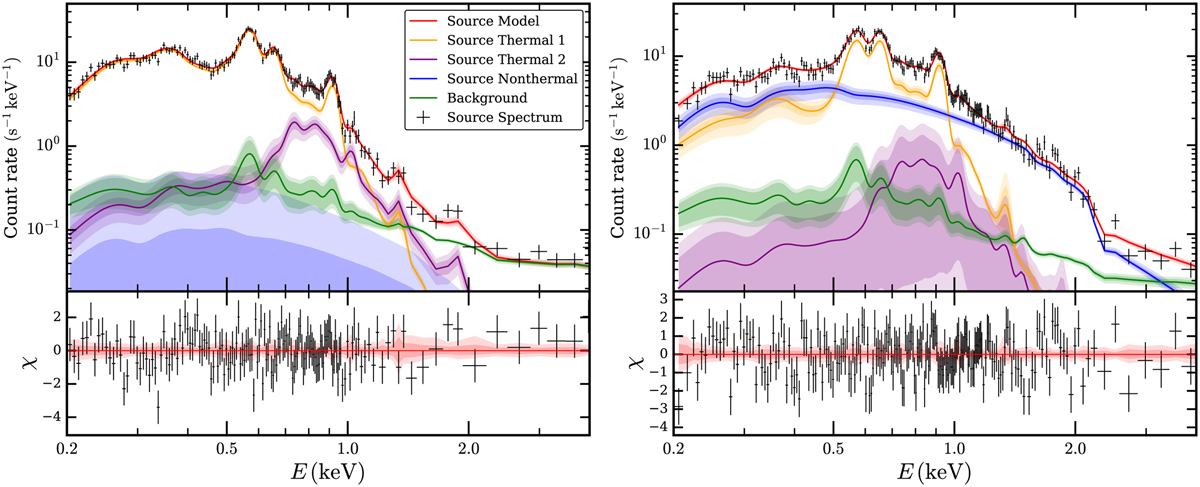
Fully modeled spectra of two sample regions. The region in the left panel (see Fig. 5) is dominated only by thermal emission, while the right panel exhibits a strong nonthermal contribution. In both panels, the model range predicted by the posterior distribution of the 2TNT spectral model parameters is displayed, with the contributions of background, nonthermal, and the two thermal components indicated in different colors. The background model shown here encompasses both instrumental and astrophysical components, as detailed in the text. The dark and light shaded areas correspond to the 68% and 95% central intervals of the posterior prediction of the respective model component. The lower portion of the panels indicate the residuals of the data, normalized by their error bars, with respect to the model range allowed by the posterior.
Current usage metrics show cumulative count of Article Views (full-text article views including HTML views, PDF and ePub downloads, according to the available data) and Abstracts Views on Vision4Press platform.
Data correspond to usage on the plateform after 2015. The current usage metrics is available 48-96 hours after online publication and is updated daily on week days.
Initial download of the metrics may take a while.