Fig. 3
Download original image
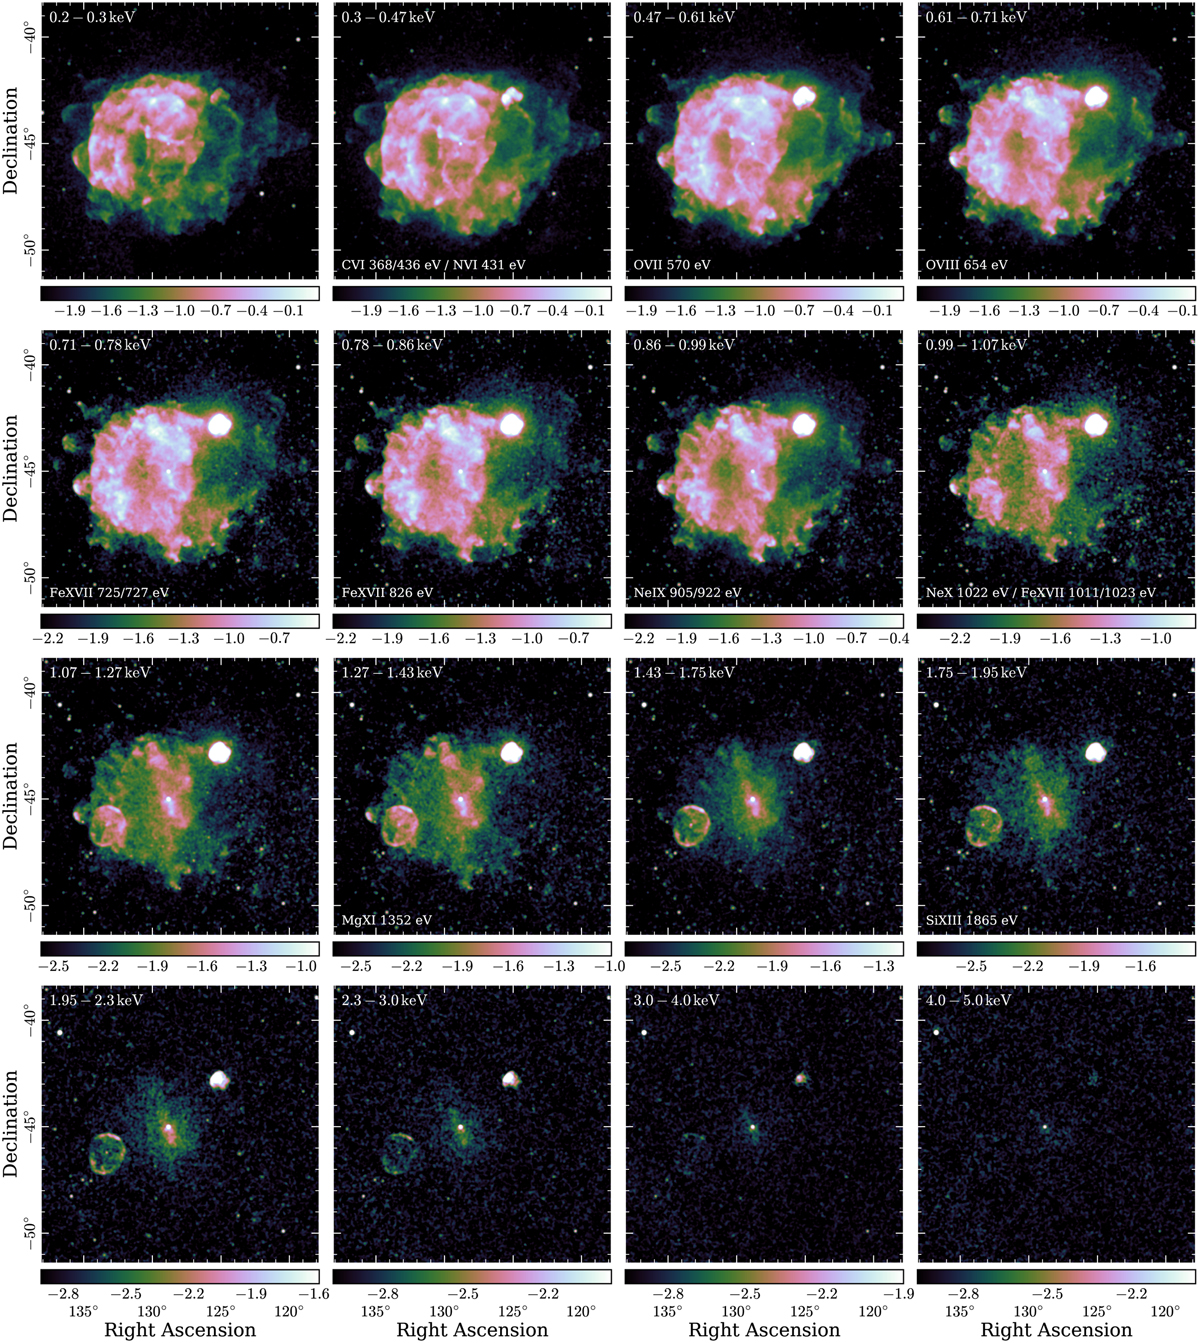
Exposure-corrected images of Vela in 16 narrow bands of ascending energy. The image in each band was smoothed with a 2.5′ Gaussian kernel. The upper right corner of each panel denotes the displayed energy band, whereas, in the lower left corner, we indicate strong spectral lines expected to contribute to the emission in the respective band. The color bar underneath each panel indicates the logarithmic range of the displayed count rate, specified in units of ct s−1 keV−1 arcmin−2.
Current usage metrics show cumulative count of Article Views (full-text article views including HTML views, PDF and ePub downloads, according to the available data) and Abstracts Views on Vision4Press platform.
Data correspond to usage on the plateform after 2015. The current usage metrics is available 48-96 hours after online publication and is updated daily on week days.
Initial download of the metrics may take a while.