Fig. 2
Download original image
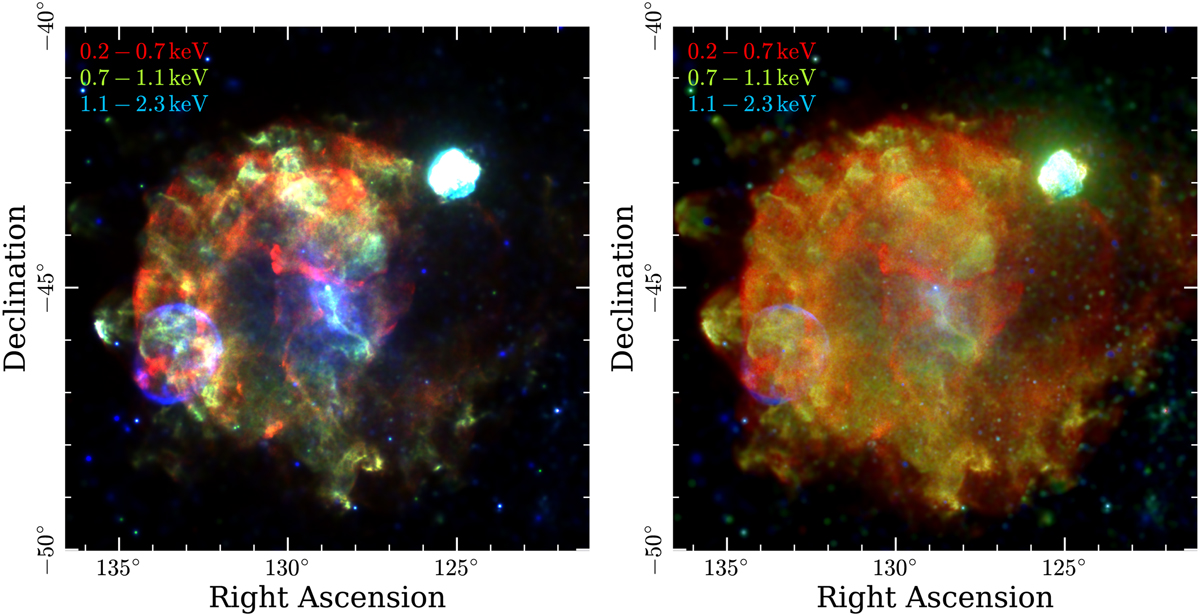
Color-enhanced images of Vela. The left panel shows the RGB image from Fig. 1 in linear brightness scale, with the saturation of each band at the 99.5th percentile of the observed brightness distribution; the right panel keeps the image in a logarithmic brightness scale, but with a quadratic stretch applied to the RGB colors.
Current usage metrics show cumulative count of Article Views (full-text article views including HTML views, PDF and ePub downloads, according to the available data) and Abstracts Views on Vision4Press platform.
Data correspond to usage on the plateform after 2015. The current usage metrics is available 48-96 hours after online publication and is updated daily on week days.
Initial download of the metrics may take a while.