Fig. A.1
Download original image
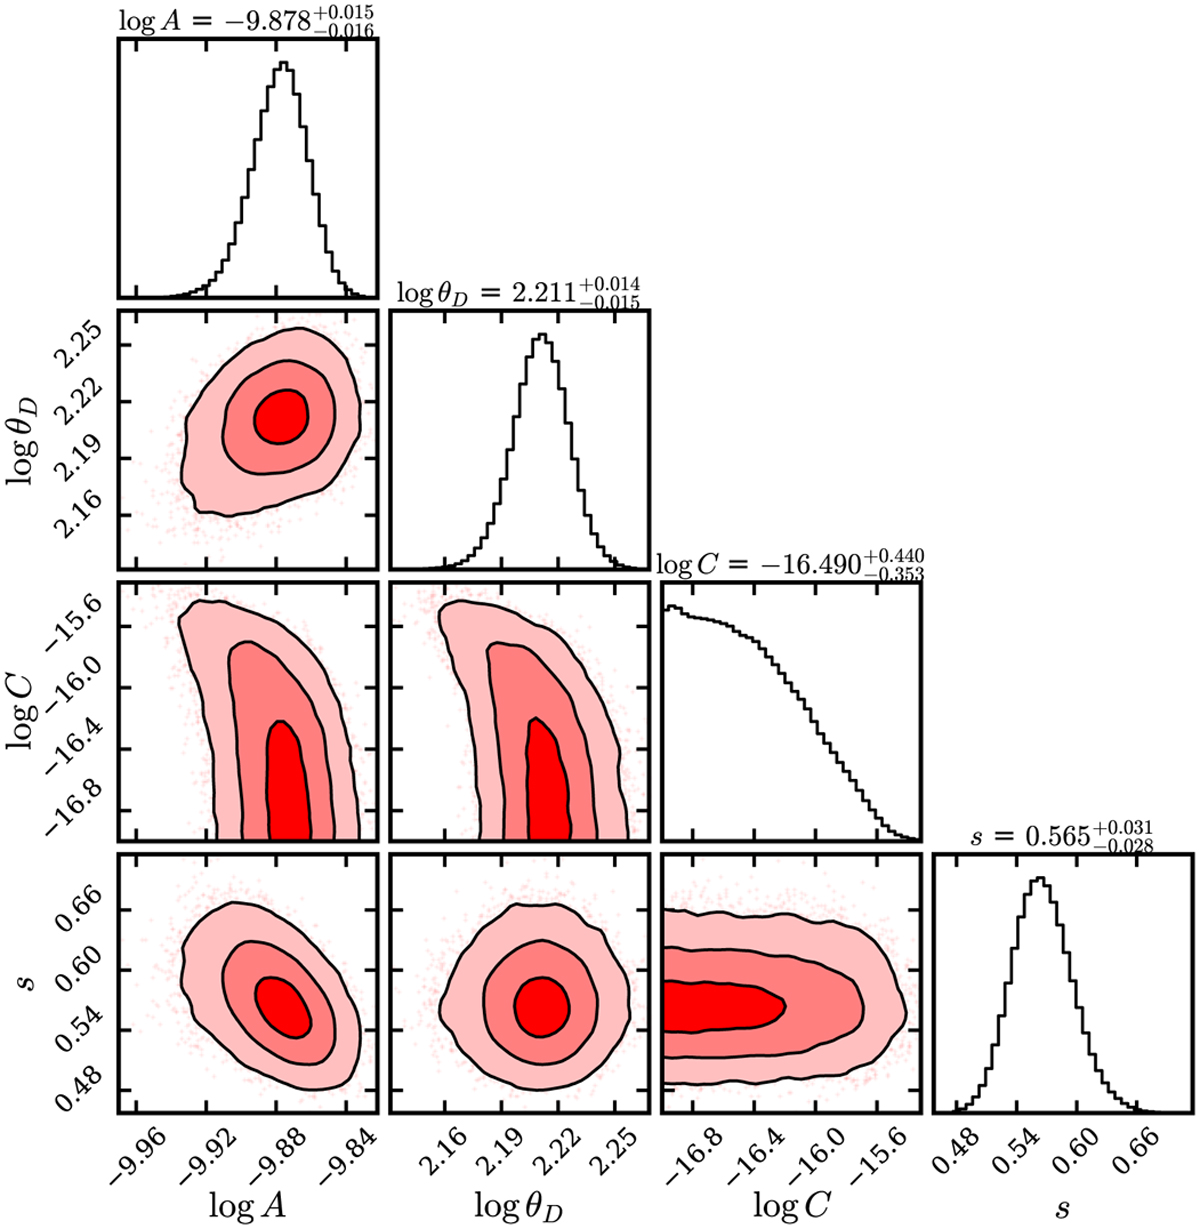
Corner plot (Foreman-Mackey 2016) displaying the posterior distribution of the parameters of the brightness profile fit shown in Fig. 12. The diagonal plots display marginalized posterior distributions of the individual parameters. The contours in the off-diagonal plots correspond to 1σ, 2σ, 3σ constraints on the joint probability distribution of two parameters. The units of the parameters A, C, and θD are erg s−1 cm−2, erg s−1 cm−2 arcmin−2, and arcmin, respectively.
Current usage metrics show cumulative count of Article Views (full-text article views including HTML views, PDF and ePub downloads, according to the available data) and Abstracts Views on Vision4Press platform.
Data correspond to usage on the plateform after 2015. The current usage metrics is available 48-96 hours after online publication and is updated daily on week days.
Initial download of the metrics may take a while.