Fig. 12
Download original image
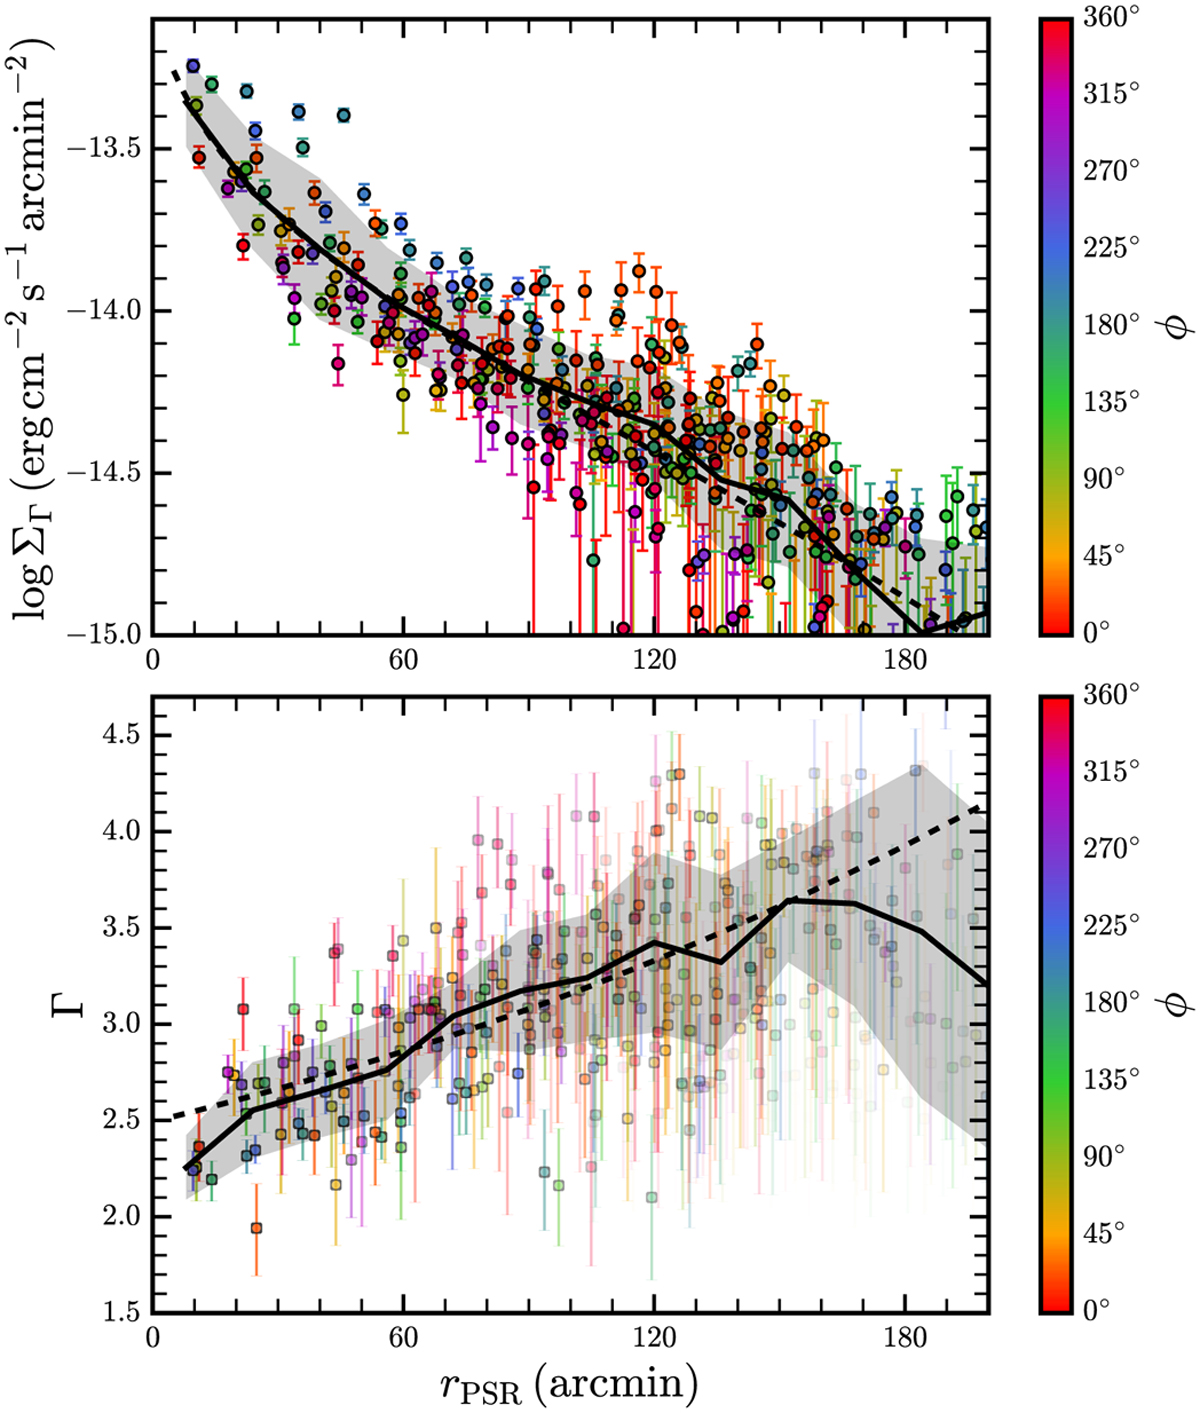
Radial evolution of nonthermal emission from Vela X. The top panel depicts the nonthermal surface brightness ΣГ of each Voronoi bin in the 1.0–5.0 keV range from the 2TNT model, plotted against its angular distance rPSR from the pulsar. The bottom panel shows the measured spectral index Г versus rPSR, where the transparency of the individual markers indicates the relative contribution of the nonthermal component to the hard spectrum. In each panel, the marker color indicates the direction of the bin, that is, its relative angle ϕ (east of north) with respect to the pulsar position. In both plots, the solid black line and shaded area indicate the weighted average and associated standard deviation of the measured quantities, determined within narrow radial bins. The dashed lines indicate the best fit of the brightness profile (top) and radial spectral softening (bottom), using the models described in the text. All bins located within 1.2° from the center of Vela Jr. have been excluded from this figure to remove any contamination by its nonthermal shell.
Current usage metrics show cumulative count of Article Views (full-text article views including HTML views, PDF and ePub downloads, according to the available data) and Abstracts Views on Vision4Press platform.
Data correspond to usage on the plateform after 2015. The current usage metrics is available 48-96 hours after online publication and is updated daily on week days.
Initial download of the metrics may take a while.