Fig. 10
Download original image
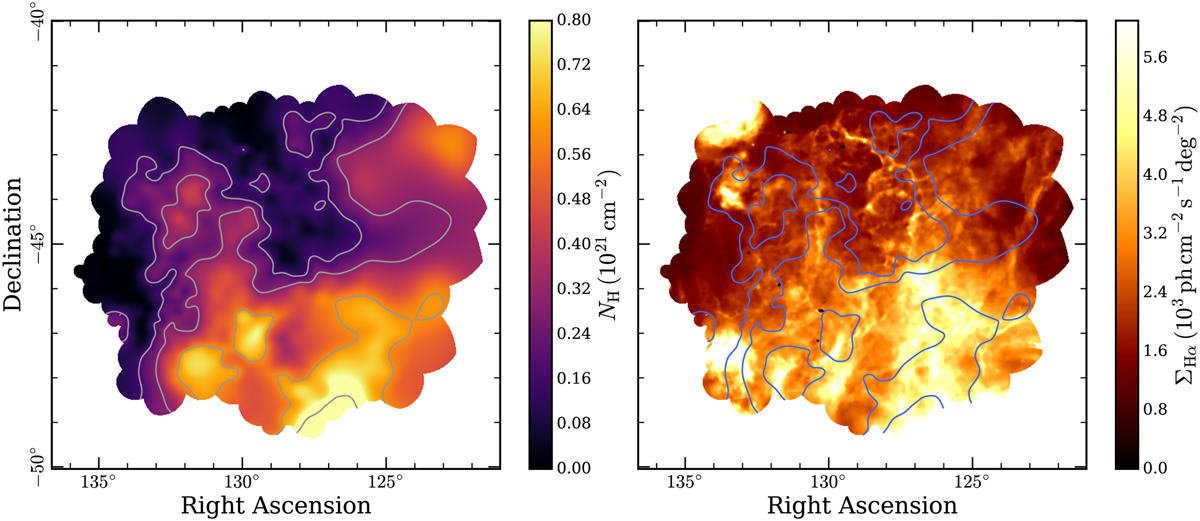
Comparison between X-ray absorption and Hα emission. The left panel displays a smoothed map of our measured NH values toward Vela, with contours at the level of NH = 1.7, 3.0, 6.0, 10.0 × 1020 cm−2. The same contours are overlaid on a map of the surface brightness of Hα emission in the region in the right panel. Both panels employ a linear color scale, and have been masked as in Fig. 5.
Current usage metrics show cumulative count of Article Views (full-text article views including HTML views, PDF and ePub downloads, according to the available data) and Abstracts Views on Vision4Press platform.
Data correspond to usage on the plateform after 2015. The current usage metrics is available 48-96 hours after online publication and is updated daily on week days.
Initial download of the metrics may take a while.