Open Access
Fig. 8.
Download original image
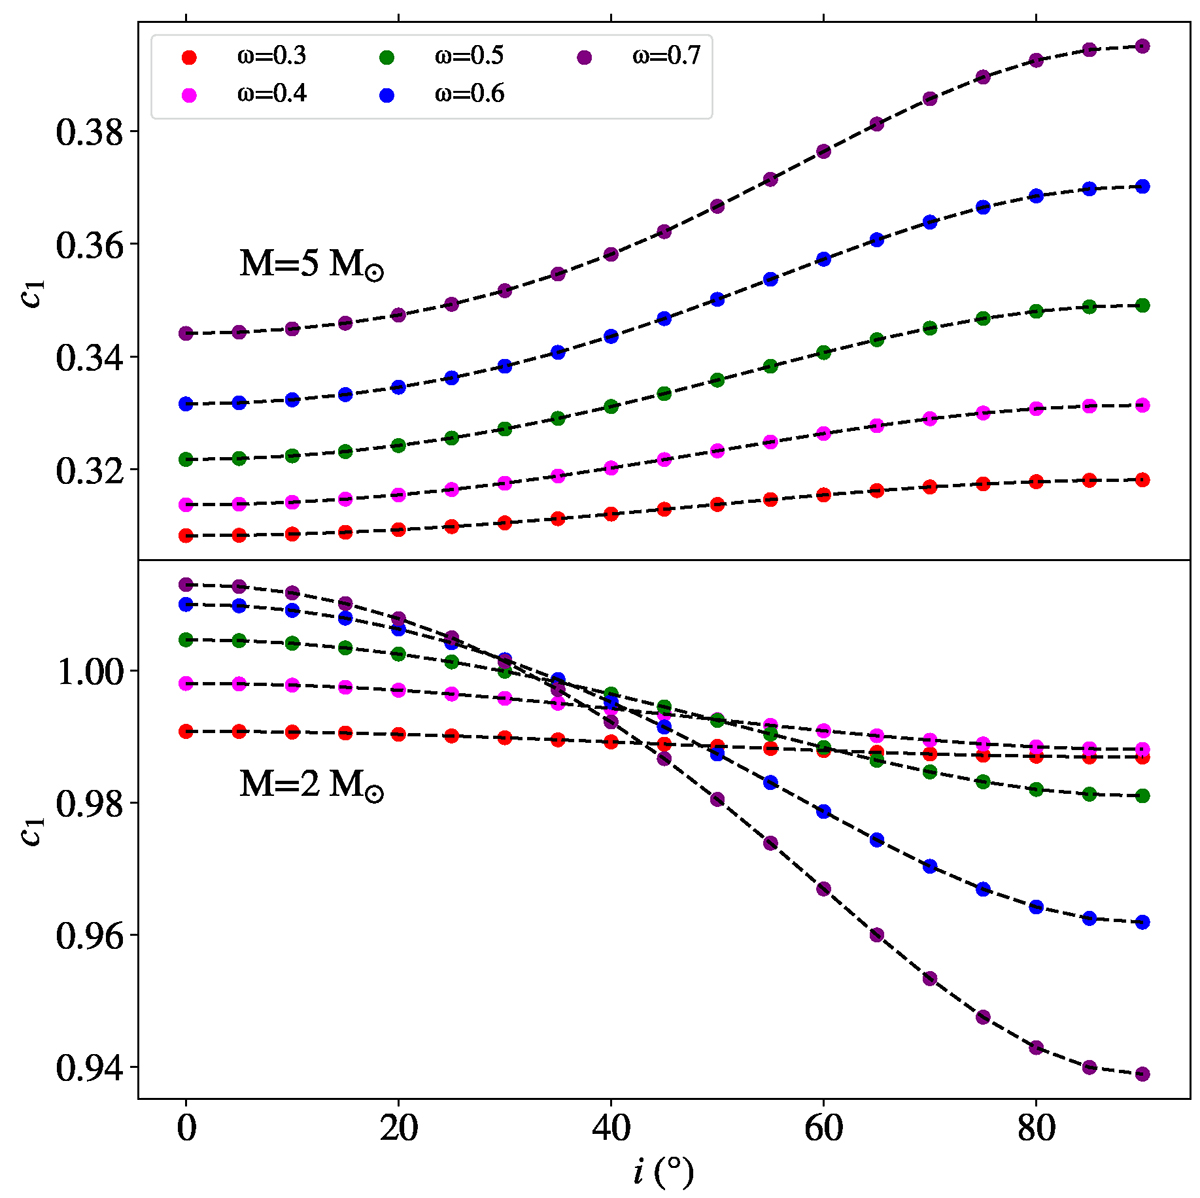
Variations in the c1 index with the inclination i for several values of ω in the range [0.3;0.7] with a step of 0.1, for a 5 M⊙ model (upper panel) and for a 2 M⊙ model (lower panel). The dashed curves represent the corresponding fits.
Current usage metrics show cumulative count of Article Views (full-text article views including HTML views, PDF and ePub downloads, according to the available data) and Abstracts Views on Vision4Press platform.
Data correspond to usage on the plateform after 2015. The current usage metrics is available 48-96 hours after online publication and is updated daily on week days.
Initial download of the metrics may take a while.