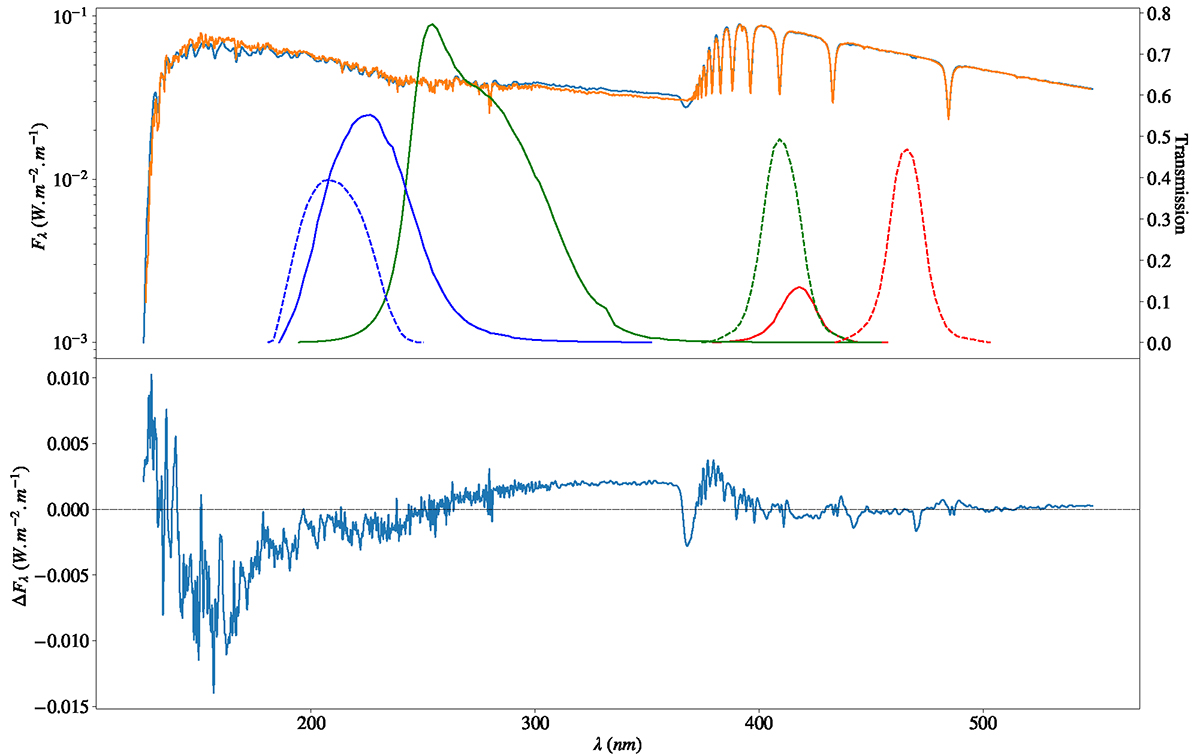
Fig. 15.
Download original image
Comparison between the spectrum from CALSPEC and from our model for Vega. Top panel: spectra of Vega from CALSPEC and from our model (orange and blue lines, respectively; left scale) and energy transmission curves of the filters used to compute the colour indices (right scale). The Strömgren filters are shown as dashed lines, while the HST filters as solid lines, the colours having the same meaning as in Figs. 7 and 9, respectively, except that the u filter is replaced here by u′. Bottom panel: difference between the flux of our Vega model and that of CALSPEC (black solid line).
Current usage metrics show cumulative count of Article Views (full-text article views including HTML views, PDF and ePub downloads, according to the available data) and Abstracts Views on Vision4Press platform.
Data correspond to usage on the plateform after 2015. The current usage metrics is available 48-96 hours after online publication and is updated daily on week days.
Initial download of the metrics may take a while.