Fig. 13.
Download original image
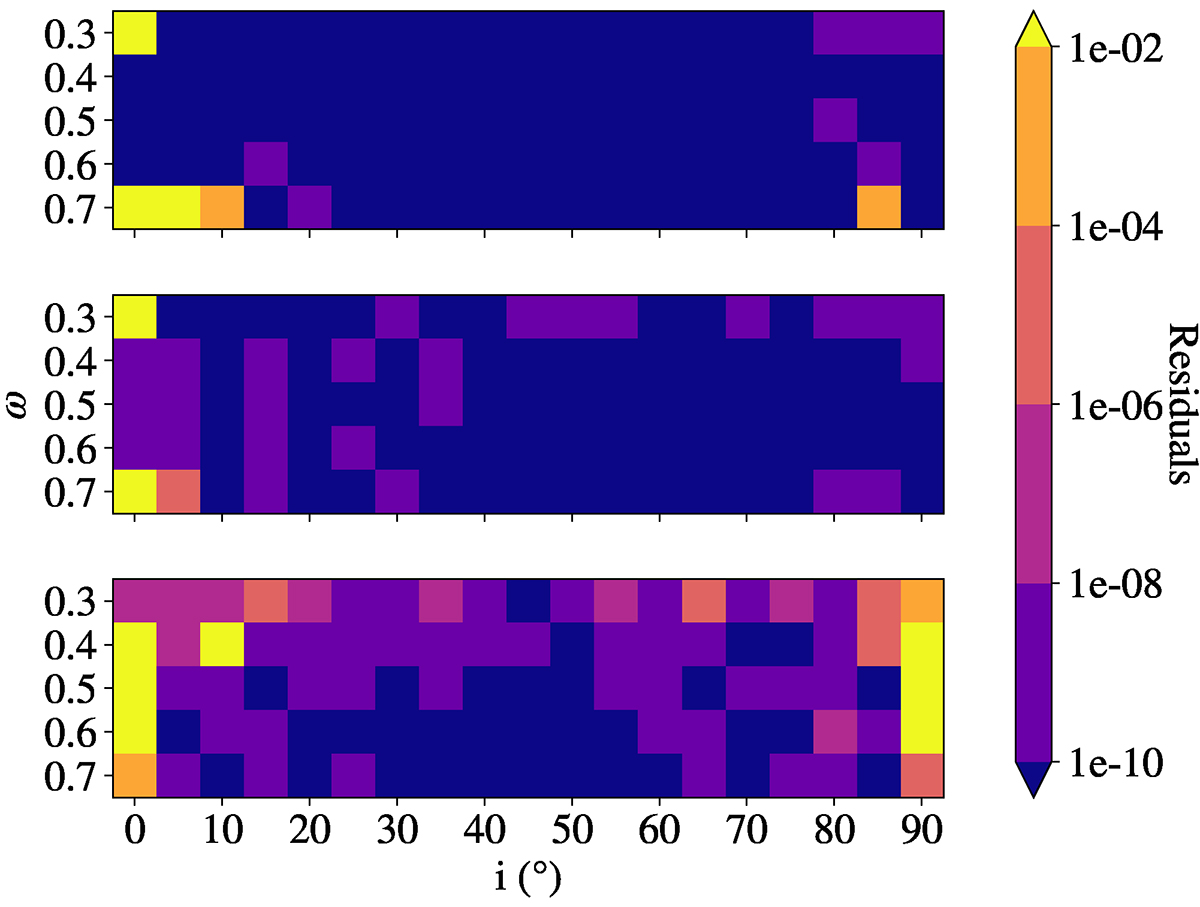
Error maps in the ω, i plane, for stars with masses equal to 3, 5, and 7 M⊙ (top, middle, and bottom panel, respectively). The colour stands for the absolute error between the retrieved and the original models defined as ![]() , where M is in M⊙ and i is in radians. The subscripts ‘sol’ and ‘obs’ stand for the solution and the original model, respectively. The yellow cells correspond to differences greater than 10−2, where the resolution possibly failed.
, where M is in M⊙ and i is in radians. The subscripts ‘sol’ and ‘obs’ stand for the solution and the original model, respectively. The yellow cells correspond to differences greater than 10−2, where the resolution possibly failed.
Current usage metrics show cumulative count of Article Views (full-text article views including HTML views, PDF and ePub downloads, according to the available data) and Abstracts Views on Vision4Press platform.
Data correspond to usage on the plateform after 2015. The current usage metrics is available 48-96 hours after online publication and is updated daily on week days.
Initial download of the metrics may take a while.