Fig. 8
Download original image
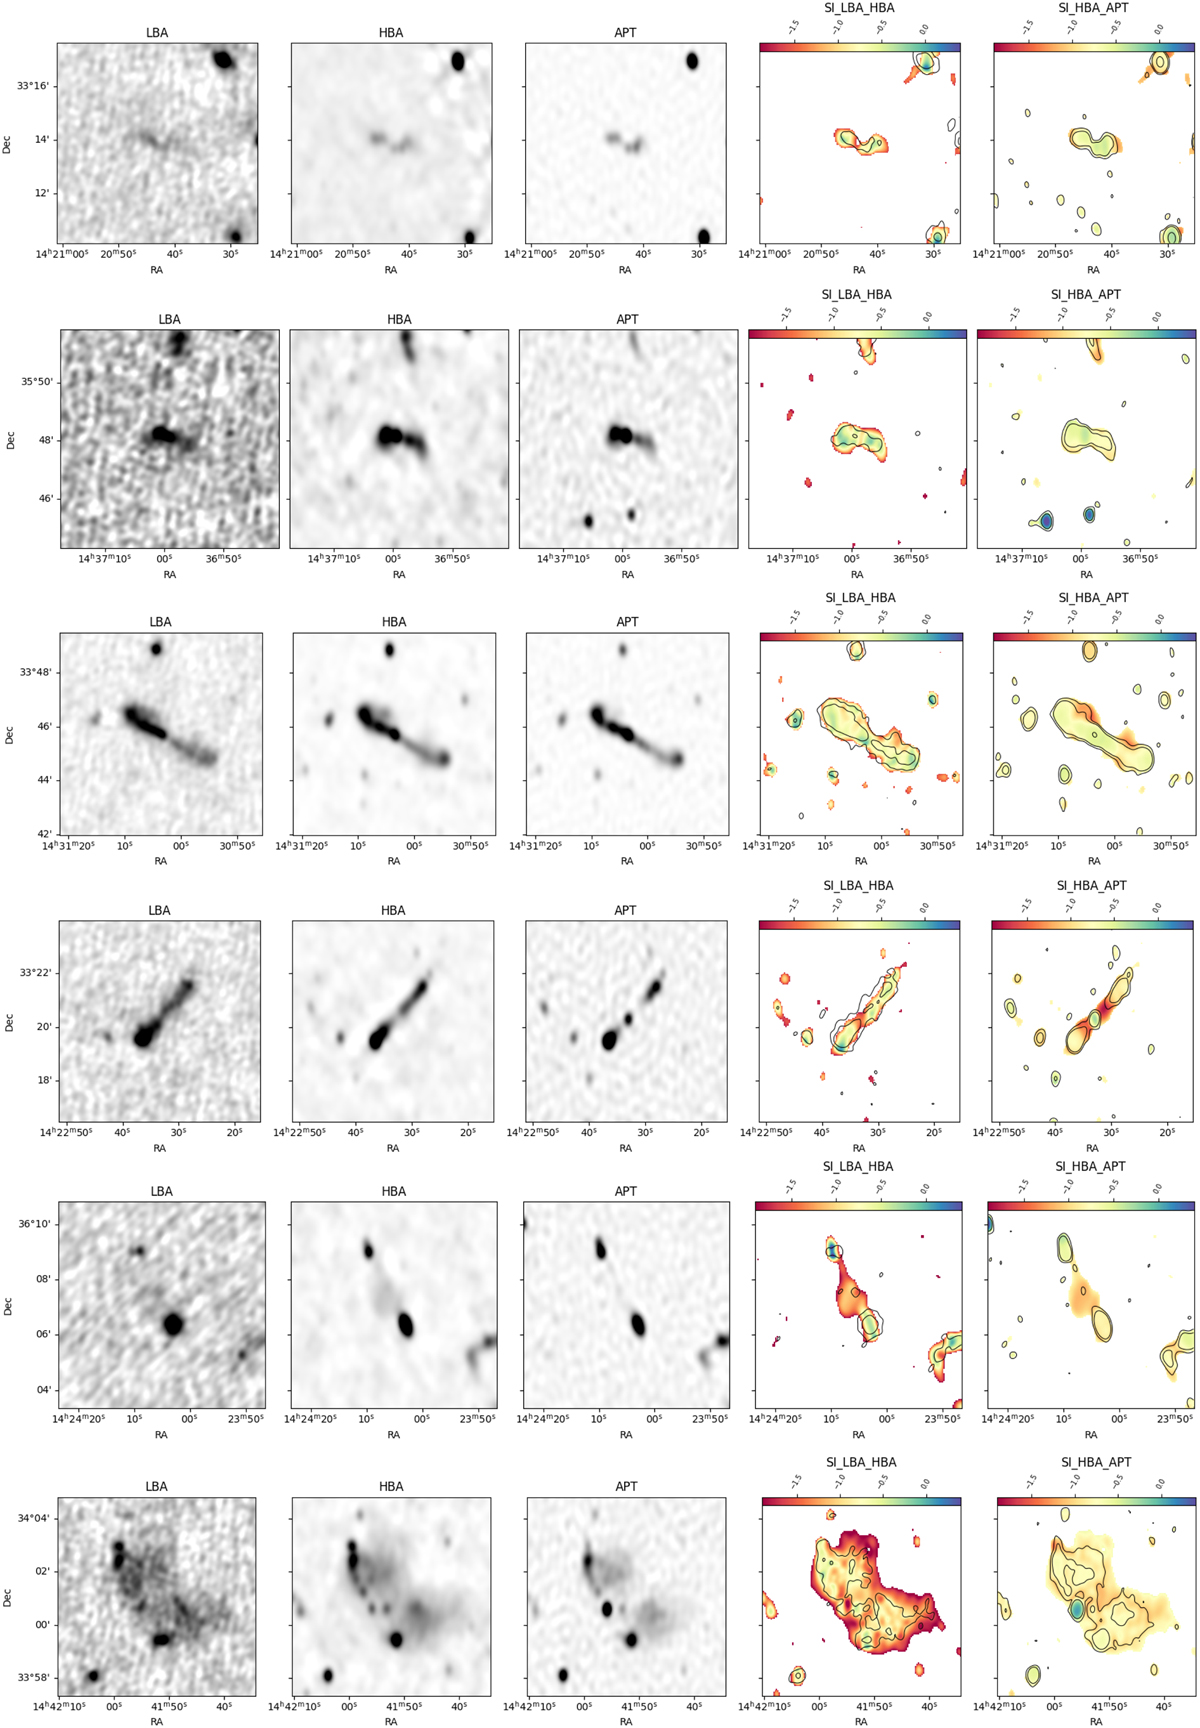
Examples of FRI (top two) and FRII (third and fourth) radio sources where the extended spectral index can be studied. See the text for details. From left to right, we plot the LBA, HBA, and Apertif images, the spectral indices LBA-HBA (the LBS contours are superposed), and HBA-Apertif (the Apertif contours are superposed). The contour levels are 3, 10, and 150 σ, where σ is the local noise level of LBA (left) and Apertif image (right; see text).
Current usage metrics show cumulative count of Article Views (full-text article views including HTML views, PDF and ePub downloads, according to the available data) and Abstracts Views on Vision4Press platform.
Data correspond to usage on the plateform after 2015. The current usage metrics is available 48-96 hours after online publication and is updated daily on week days.
Initial download of the metrics may take a while.