Fig. 6
Download original image
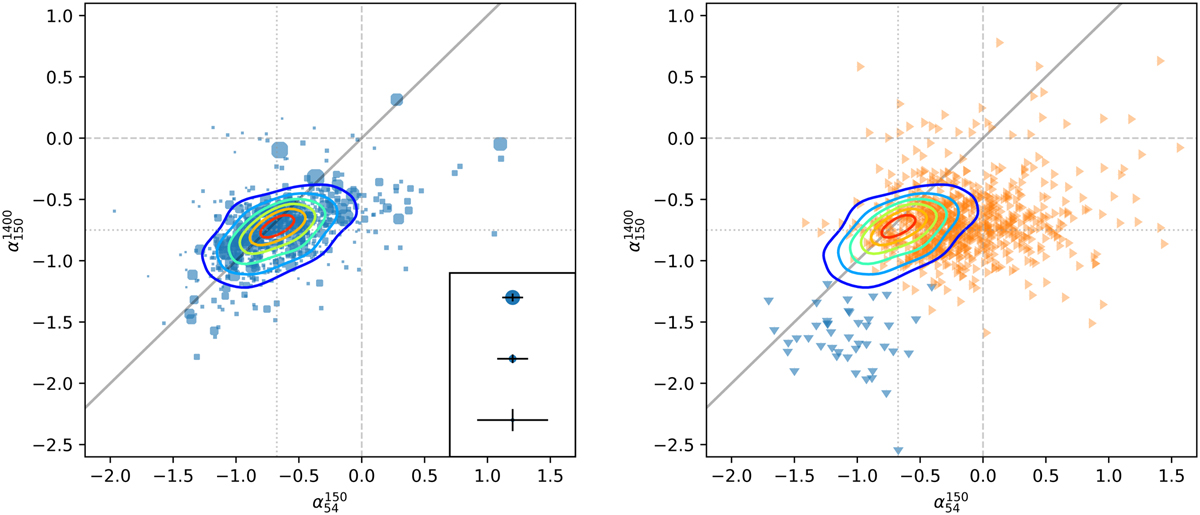
Spectral index diagrams of all sources (see text for details). The left panel shows sources detected in catalogs C4, C5, and C6. The size of the markers is proportional to the source S/N in C5. The typical errors are shown in the bottom right corner. The right panel shows the spectral index limits of the sources that are missing in either C4 or C6 estimated from the noise RMS of images M4 and M6 at the location of a source. The contours show the Gaussian-kernel density estimate. The dashed lines indicates the zero spectral index, and the dotted lines show median values of ![]() and
and ![]() calculated for the common sources.
calculated for the common sources.
Current usage metrics show cumulative count of Article Views (full-text article views including HTML views, PDF and ePub downloads, according to the available data) and Abstracts Views on Vision4Press platform.
Data correspond to usage on the plateform after 2015. The current usage metrics is available 48-96 hours after online publication and is updated daily on week days.
Initial download of the metrics may take a while.