Fig. 5
Download original image
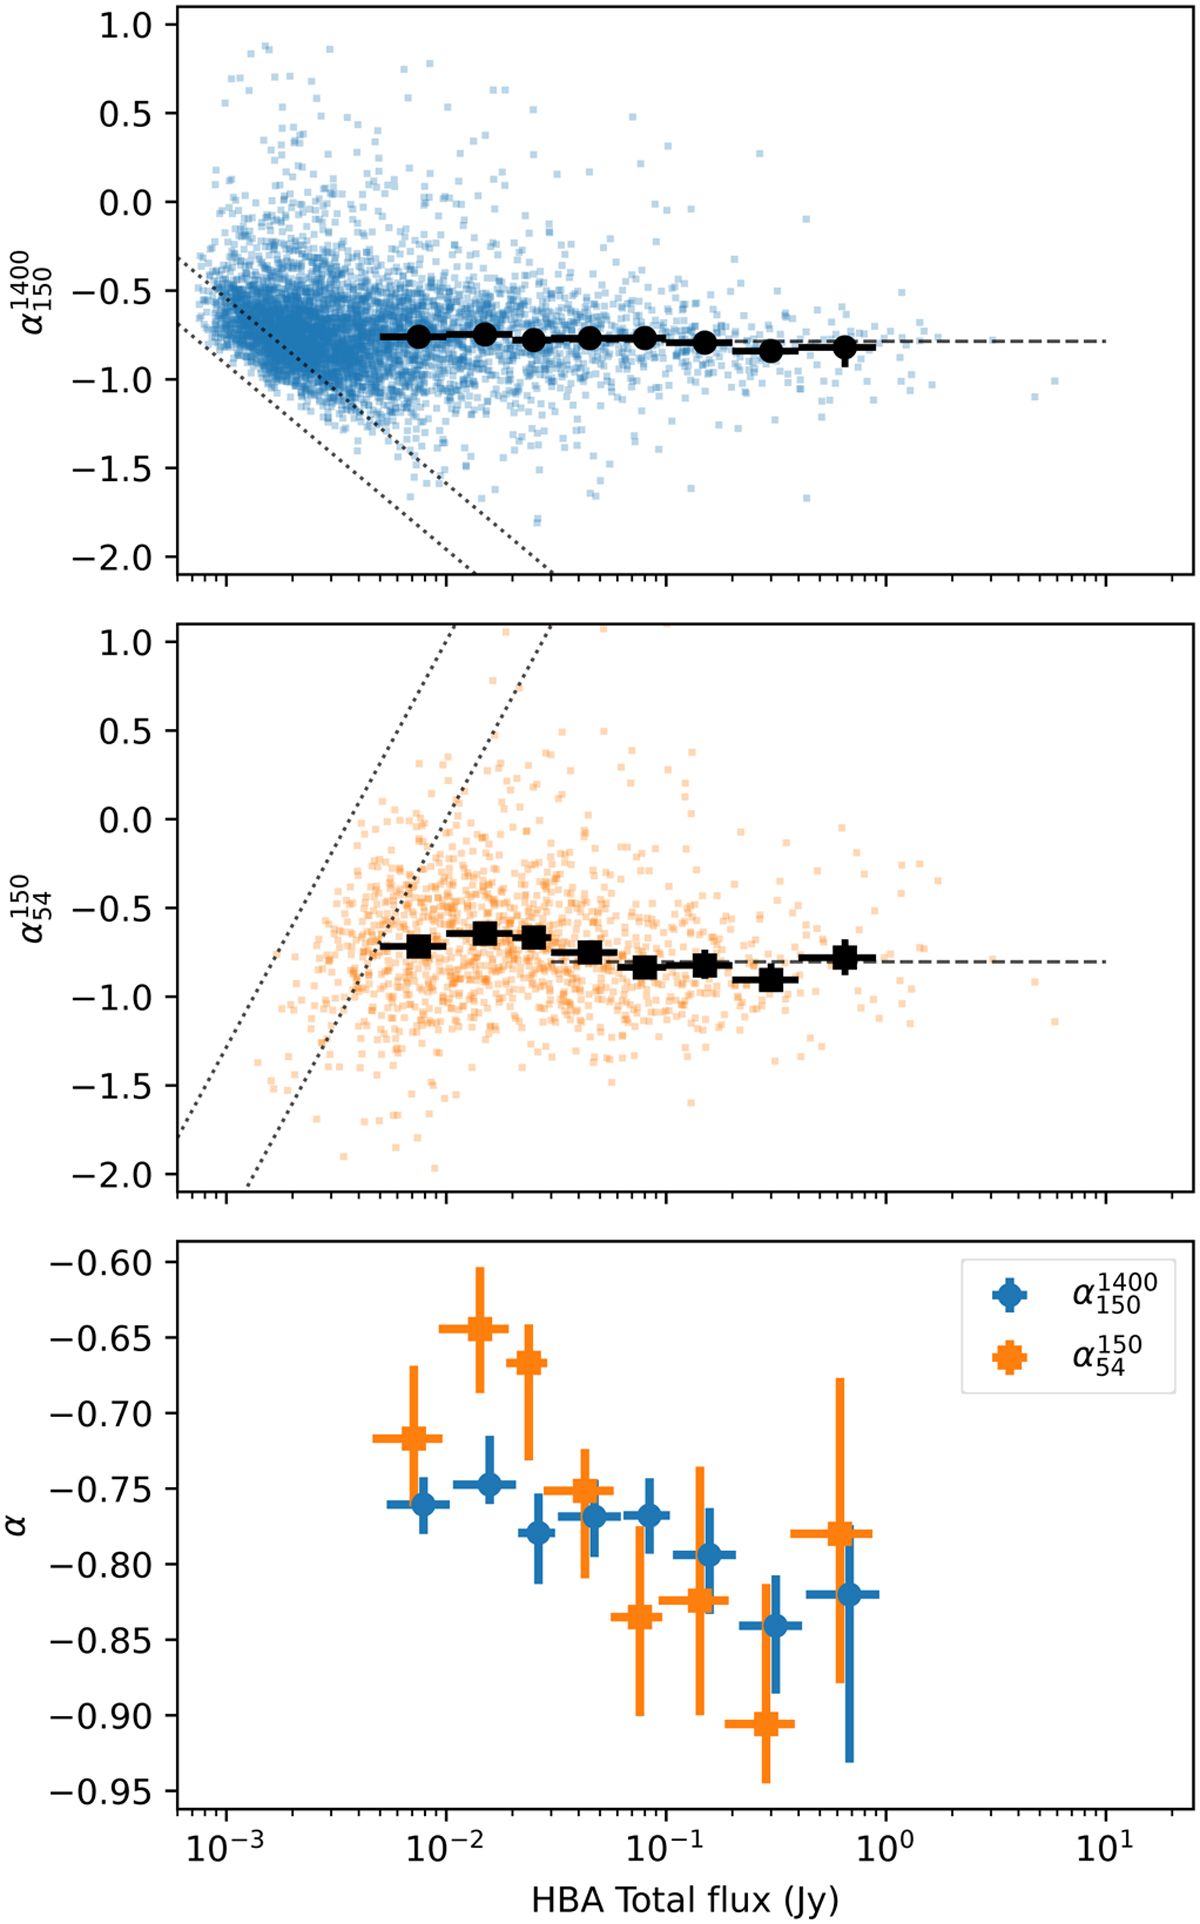
Spectral indices measured between 1400 and 150 MHz (top) and 150 and 54 MHz (middle) vs. the 150 MHz HBA total flux density. The dotted lines define the spectral index limits calculated using the minimum total flux density and the completeness level of C4 and C6. The median values calculated for the sources above the completeness limits (−0.77 and −0.73) are shown with horizontal dashed lines. Markers with bars show the median spectral index calculated inside eight flux density bins (also shown separately in the bottom panel). The bins are shown with horizontal bars. The 90% confidence intervals of the median values derived using bootstrapping are shown with vertical bars.
Current usage metrics show cumulative count of Article Views (full-text article views including HTML views, PDF and ePub downloads, according to the available data) and Abstracts Views on Vision4Press platform.
Data correspond to usage on the plateform after 2015. The current usage metrics is available 48-96 hours after online publication and is updated daily on week days.
Initial download of the metrics may take a while.