Open Access
Fig. 1
Download original image
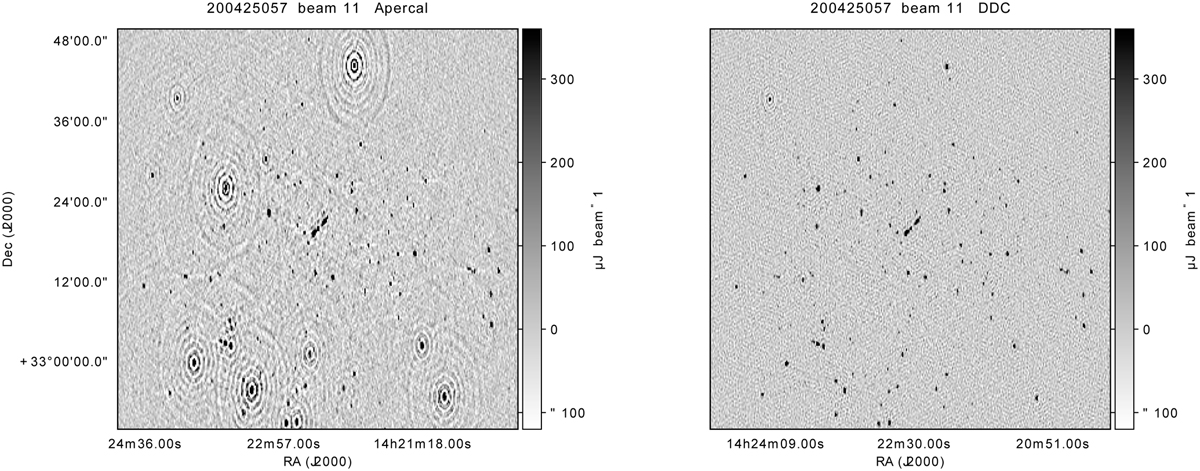
Example of the improvement in image quality as the result of including direction-dependent effects in the calibration of Apertif data. Left panel: Apertif image obtained with the old direction-independent pipeline. Right panel: image made from the same data, but applying the new direction-dependent pipeline.
Current usage metrics show cumulative count of Article Views (full-text article views including HTML views, PDF and ePub downloads, according to the available data) and Abstracts Views on Vision4Press platform.
Data correspond to usage on the plateform after 2015. The current usage metrics is available 48-96 hours after online publication and is updated daily on week days.
Initial download of the metrics may take a while.