Fig. 4.
Download original image
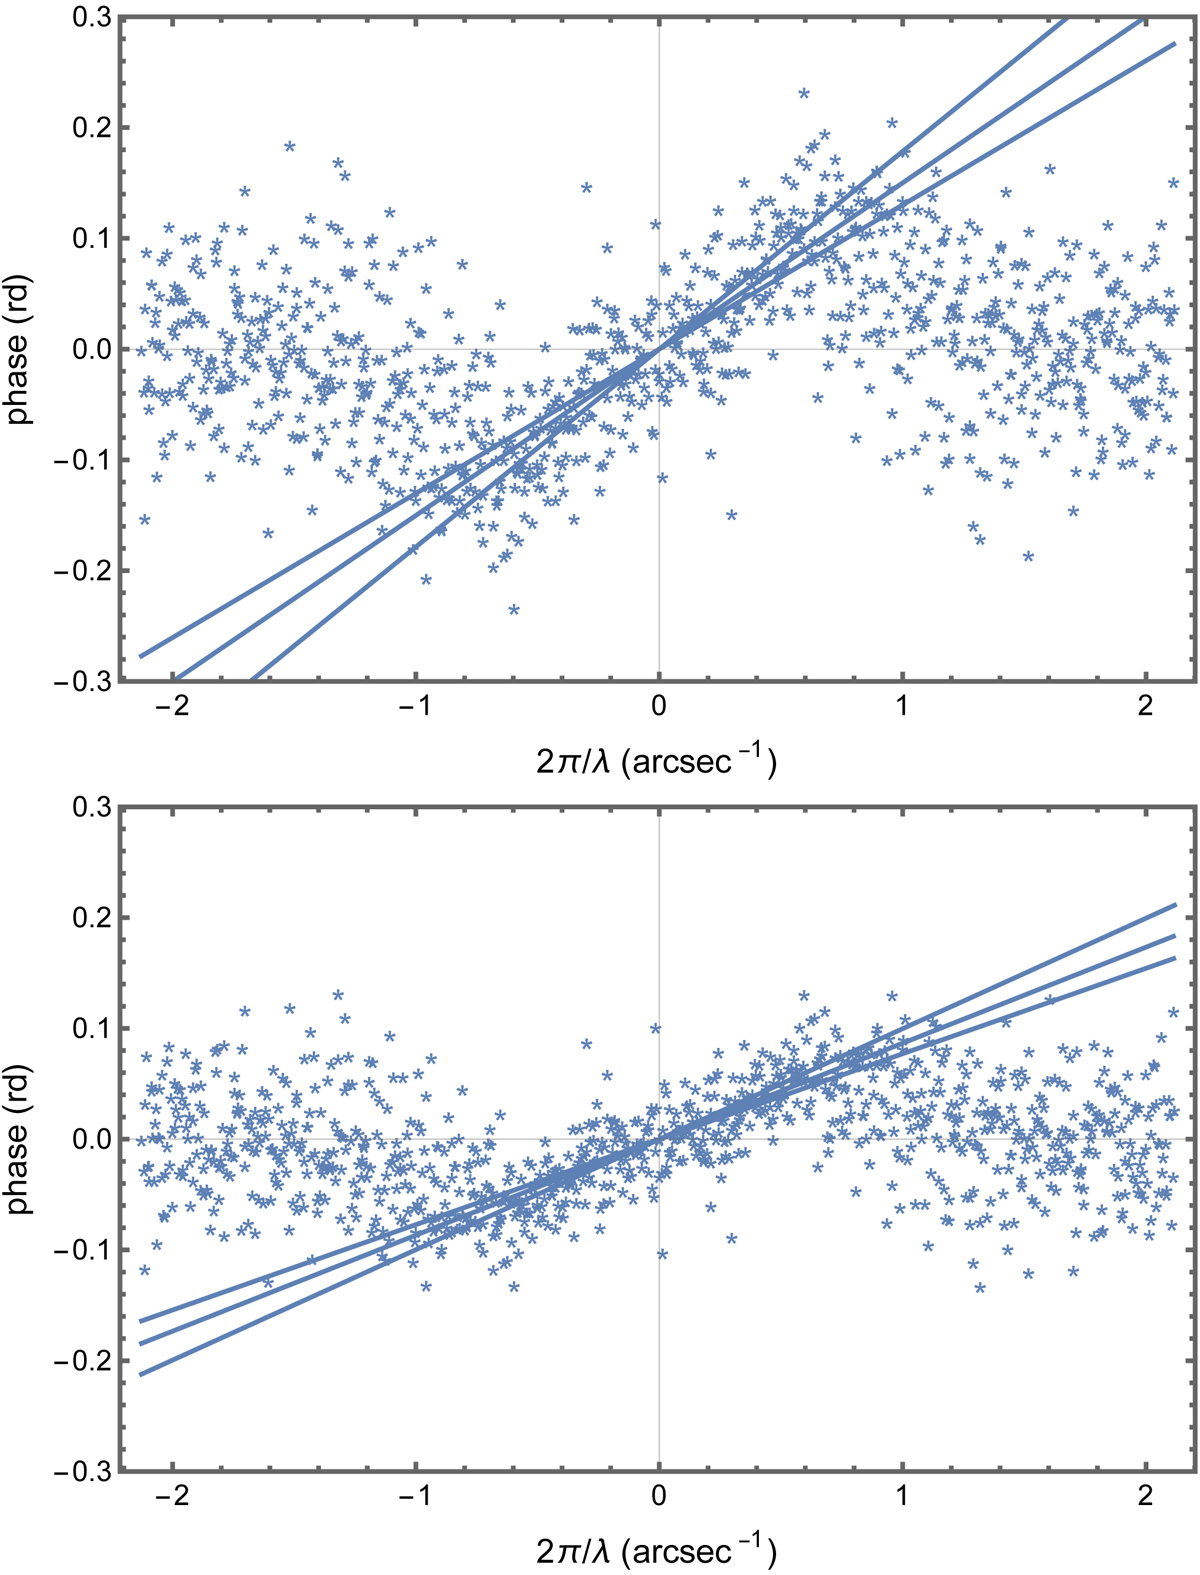
Phase of the cross-spectrum as function of the spatial frequency for three observing sequences. The observed regions are at the center of the solar disk and the spectrograph slit is oriented along the west-east axis. The straight lines show linear fits of the phase at spatial frequency smaller than 0.6 arcsec−1. Upper panel: cross-spectrum phase of the reference image and image at line cord 16. Lower panel: same for line cord 18.
Current usage metrics show cumulative count of Article Views (full-text article views including HTML views, PDF and ePub downloads, according to the available data) and Abstracts Views on Vision4Press platform.
Data correspond to usage on the plateform after 2015. The current usage metrics is available 48-96 hours after online publication and is updated daily on week days.
Initial download of the metrics may take a while.