Fig. 2.
Download original image
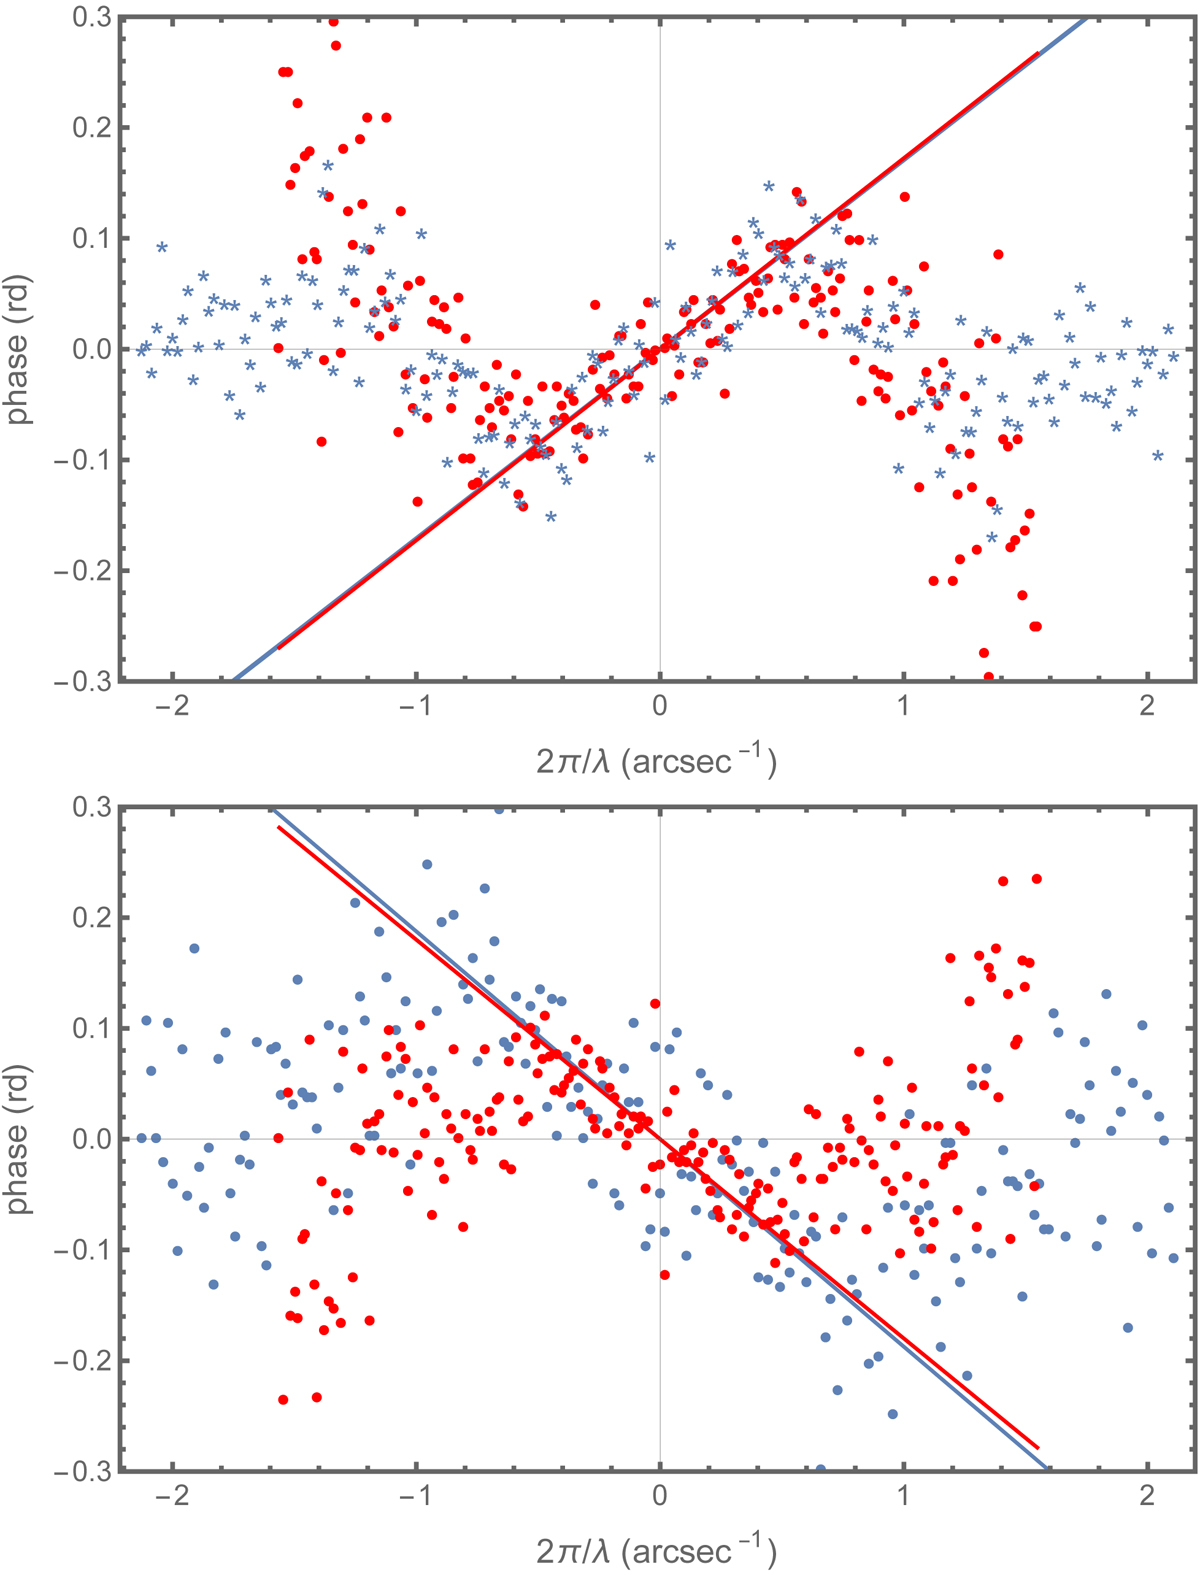
Phase of the cross-spectrum of the images at the reference level and at line cord 16 as function of the spatial frequency. The spectrograph slit is oriented along the north-south axis. Red symbols: results obtained with the Hinode data (in blue: Themis data). Upper panel: results for regions at cosθ = 0.74 in the southern hemisphere on the solar polar axis. Lower panel: results at cosθ = 0.74 in the northern hemisphere.
Current usage metrics show cumulative count of Article Views (full-text article views including HTML views, PDF and ePub downloads, according to the available data) and Abstracts Views on Vision4Press platform.
Data correspond to usage on the plateform after 2015. The current usage metrics is available 48-96 hours after online publication and is updated daily on week days.
Initial download of the metrics may take a while.