Fig. 5
Download original image
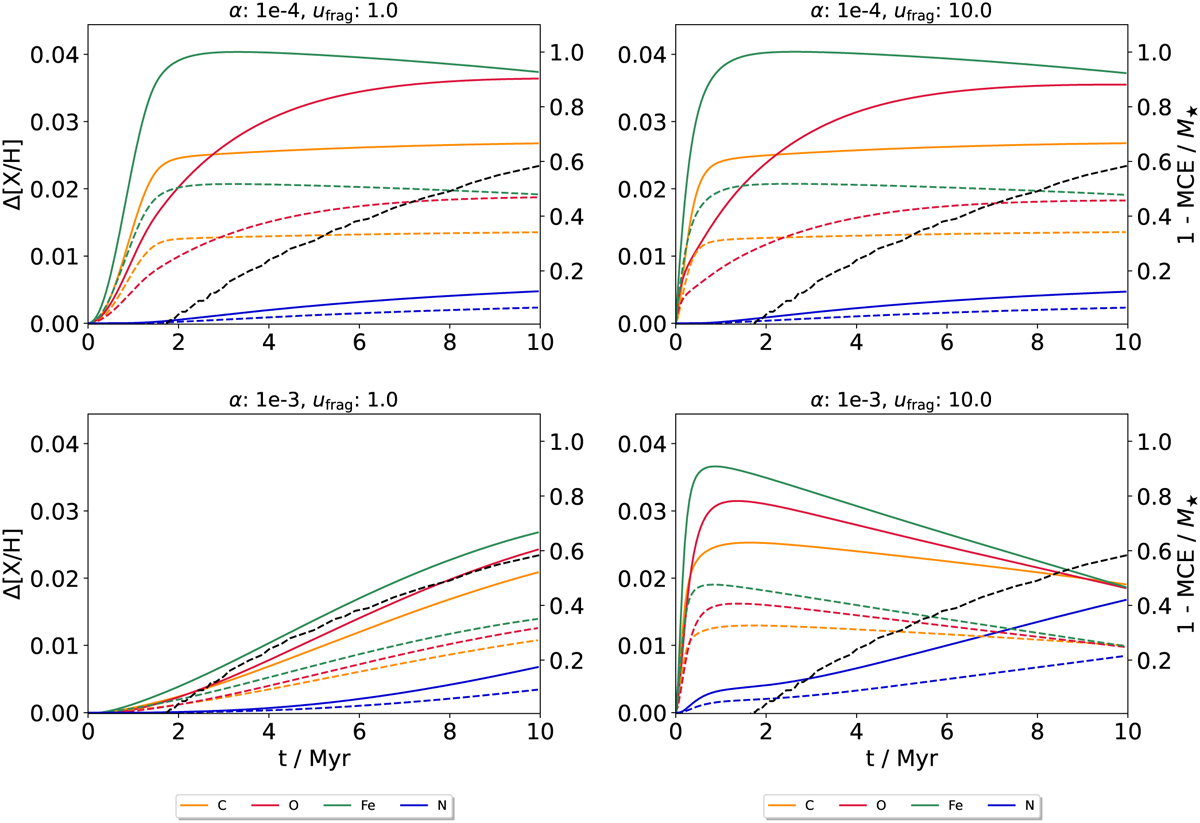
Stellar convective envelope elemental abundances as a function of time relative to the initial abundances, [X/H] – [X/H]0. Four different simulations are shown, varying α and ufrag to consider different maximum grain sizes in combination with different gas accretion speeds. Differently colored solid lines represent the abundances of the elements carbon (yellow), oxygen (red), iron (green), and nitrogen (blue), while the black dashed line shows the convective zone mass evolution as ![]() , as in Fig. 2, corresponding to M⋆ = 1 M⊙ and [Fe/H] = 0. Solid lines indicate results for M0 = 0.1, while dashed lines show a comparison to simulations with M0 = 0.05.
, as in Fig. 2, corresponding to M⋆ = 1 M⊙ and [Fe/H] = 0. Solid lines indicate results for M0 = 0.1, while dashed lines show a comparison to simulations with M0 = 0.05.
Current usage metrics show cumulative count of Article Views (full-text article views including HTML views, PDF and ePub downloads, according to the available data) and Abstracts Views on Vision4Press platform.
Data correspond to usage on the plateform after 2015. The current usage metrics is available 48-96 hours after online publication and is updated daily on week days.
Initial download of the metrics may take a while.