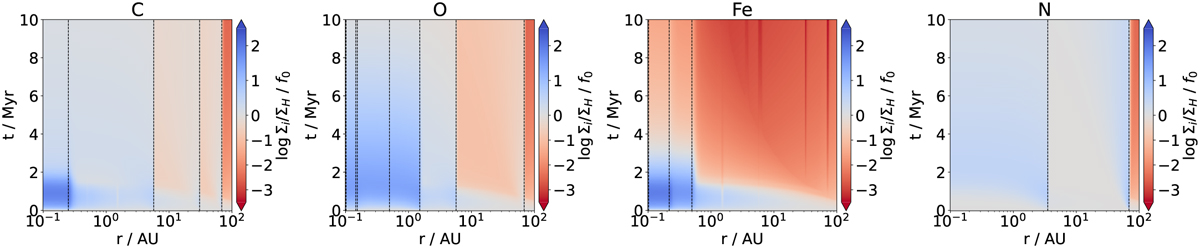
Fig. 3
Download original image
Surface density evolution of carbon, oxygen, iron and nitrogen, for α = 1 × 10⁻⁴. The sum of the gas and dust component is shown. The color indicates the surface density of the element with respect to the hydrogen surface density, compared to the initial fraction at a given location on a logarithmic scale, such that a blue color indicates that the surface density of the element is enriched, and vice-versa for a red color. Due to this choice of norm, a blue color at the inner edge corresponds to an increase in [X/H] for that element up to the magnitude of the enrichment. All evaporation front locations of species where the corresponding element is a component in are indicated with black dashed lines in the relevant panels.
Current usage metrics show cumulative count of Article Views (full-text article views including HTML views, PDF and ePub downloads, according to the available data) and Abstracts Views on Vision4Press platform.
Data correspond to usage on the plateform after 2015. The current usage metrics is available 48-96 hours after online publication and is updated daily on week days.
Initial download of the metrics may take a while.