Fig. 2
Download original image
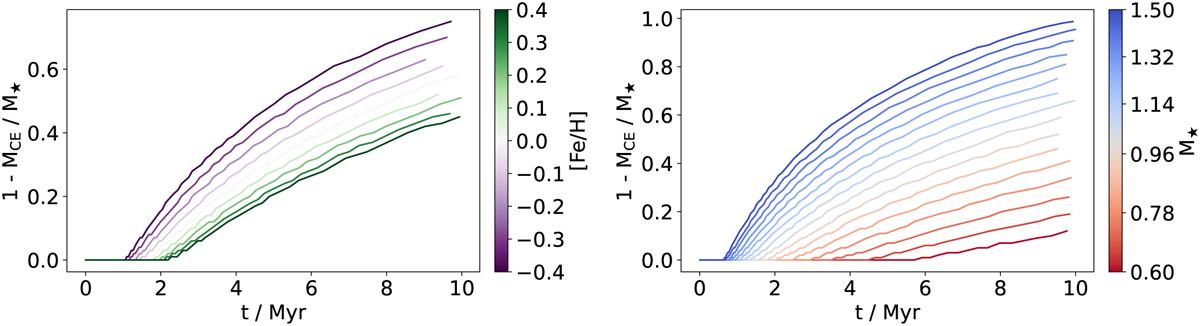
Time evolution of the stellar convective envelope mass obtained from models by Hoppe et al. (2020) for various [Fe/H] (left panel) and M⋆ (right panel), indicated by a change in line color. The ordinate shows 1 – MCE/M⋆, so that if the star has a more massive convective zone, a lower value is shown, to indicate that the convective zone abundances adapt to the composition of the accretion flux more slowly.
Current usage metrics show cumulative count of Article Views (full-text article views including HTML views, PDF and ePub downloads, according to the available data) and Abstracts Views on Vision4Press platform.
Data correspond to usage on the plateform after 2015. The current usage metrics is available 48-96 hours after online publication and is updated daily on week days.
Initial download of the metrics may take a while.