Fig. 13
Download original image
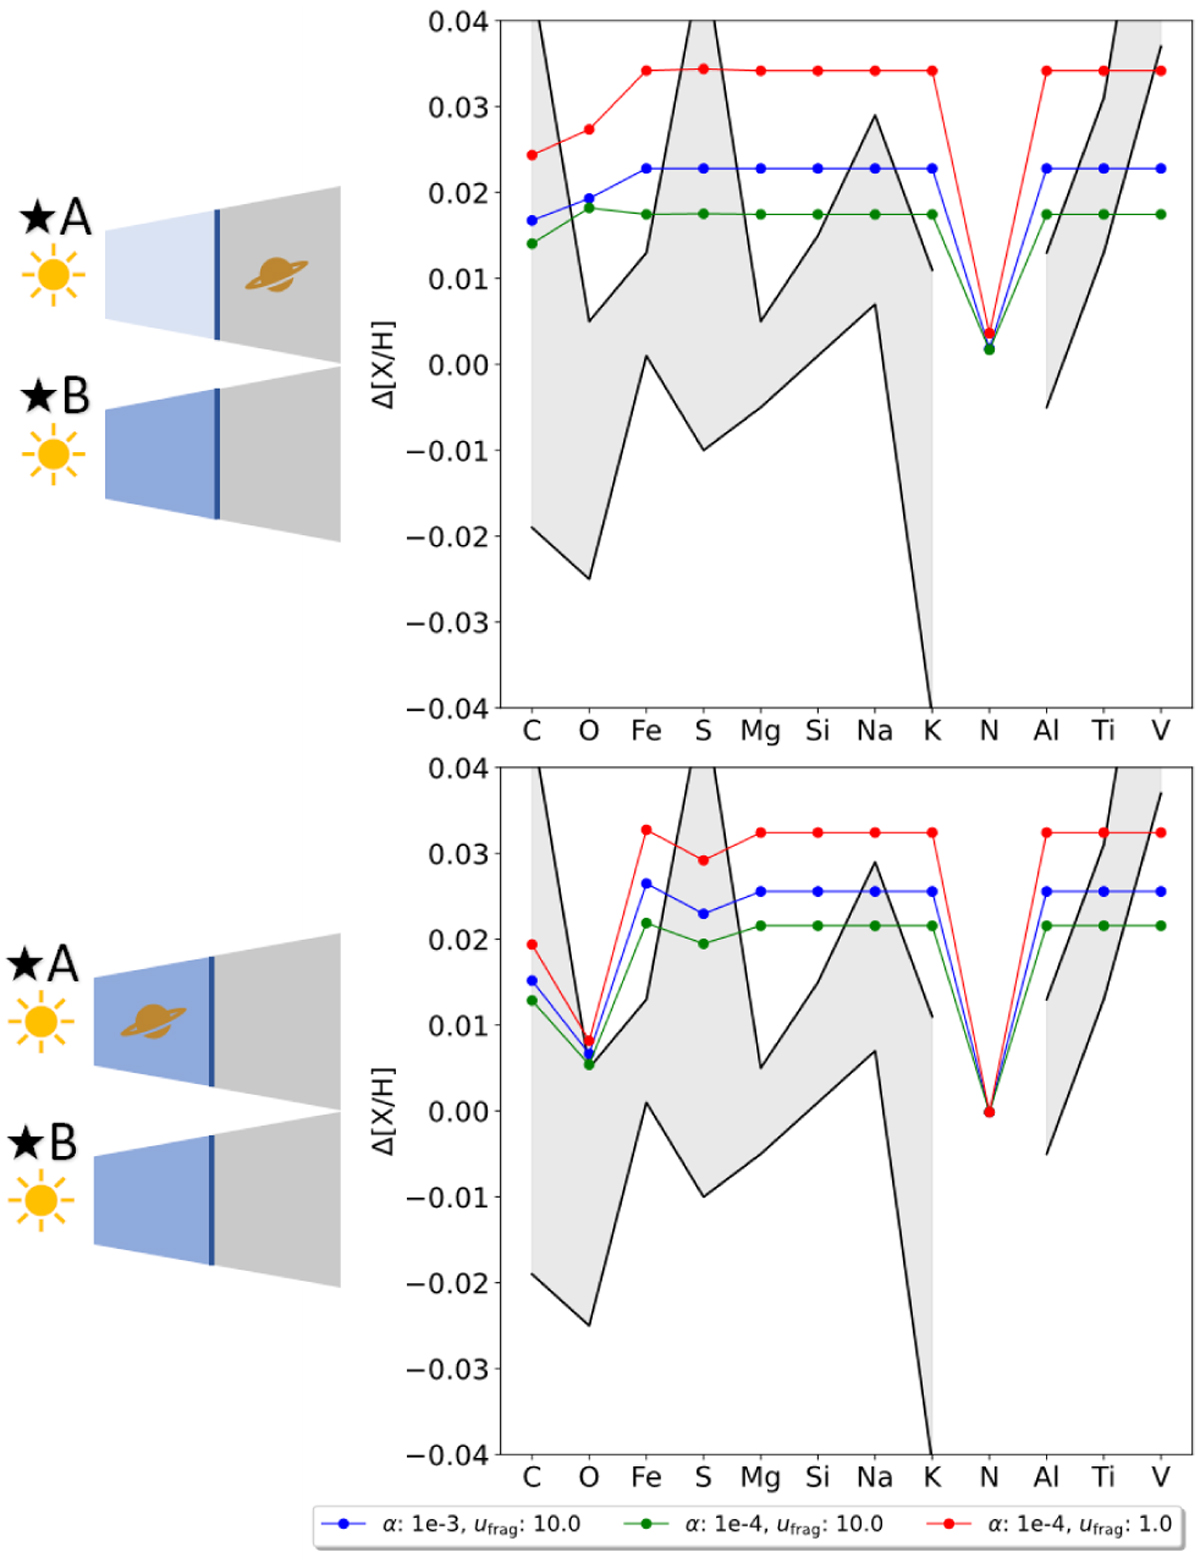
Abundance differences between HD106515 B and A caused by planet formation taking place only around star A. The top shows the case of the planet forming where it is observed today at 4.5 AU, which lies outside the water ice line, while the bottom considers the planet forming inside the water ice line, just outside ![]() . The gray area delimited by black lines corresponds to the measurements including the 1σ error (Liu et al. 2021). In blue, the disks around the constituents are parameterized by α = 1 × 10⁻³, ufrag = 10 m s−1. The red and green lines describe disks with a viscosity of α = 1 × 10⁻⁴ with ufrag = 1 m s−1 and ufrag = 10 m s−1, respectively.
. The gray area delimited by black lines corresponds to the measurements including the 1σ error (Liu et al. 2021). In blue, the disks around the constituents are parameterized by α = 1 × 10⁻³, ufrag = 10 m s−1. The red and green lines describe disks with a viscosity of α = 1 × 10⁻⁴ with ufrag = 1 m s−1 and ufrag = 10 m s−1, respectively.
Current usage metrics show cumulative count of Article Views (full-text article views including HTML views, PDF and ePub downloads, according to the available data) and Abstracts Views on Vision4Press platform.
Data correspond to usage on the plateform after 2015. The current usage metrics is available 48-96 hours after online publication and is updated daily on week days.
Initial download of the metrics may take a while.