Fig. 12
Download original image
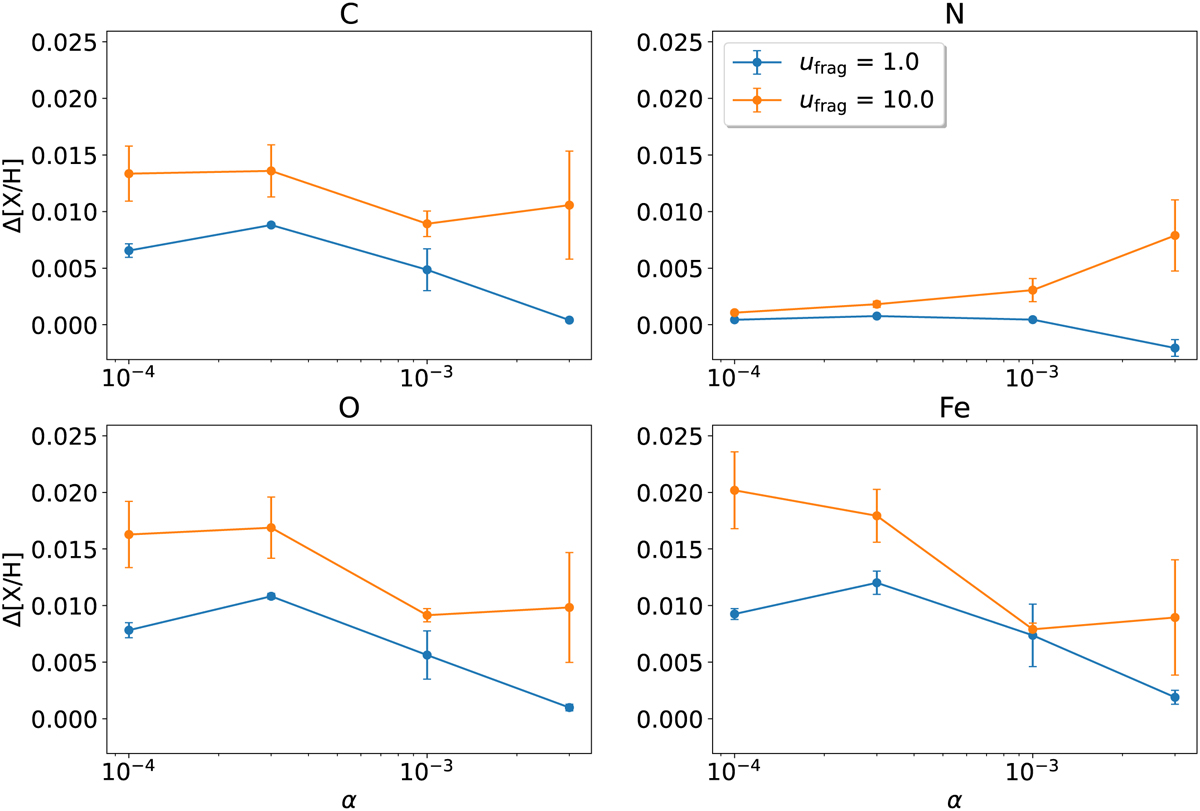
Solar convective zone abundance changes created by accretion of a disk forming Jupiter as a function of disk viscosity α for ufrag = 1 m s−1 (blue) and ufrag = 10 m s−1 (orange). The data points show the mean value for simulations with R0 ∈ {75 AU, 150 AU} and M0 ∈ {0.05, 0.1}, and the error bars indicate the standard deviation.
Current usage metrics show cumulative count of Article Views (full-text article views including HTML views, PDF and ePub downloads, according to the available data) and Abstracts Views on Vision4Press platform.
Data correspond to usage on the plateform after 2015. The current usage metrics is available 48-96 hours after online publication and is updated daily on week days.
Initial download of the metrics may take a while.