Fig. 11
Download original image
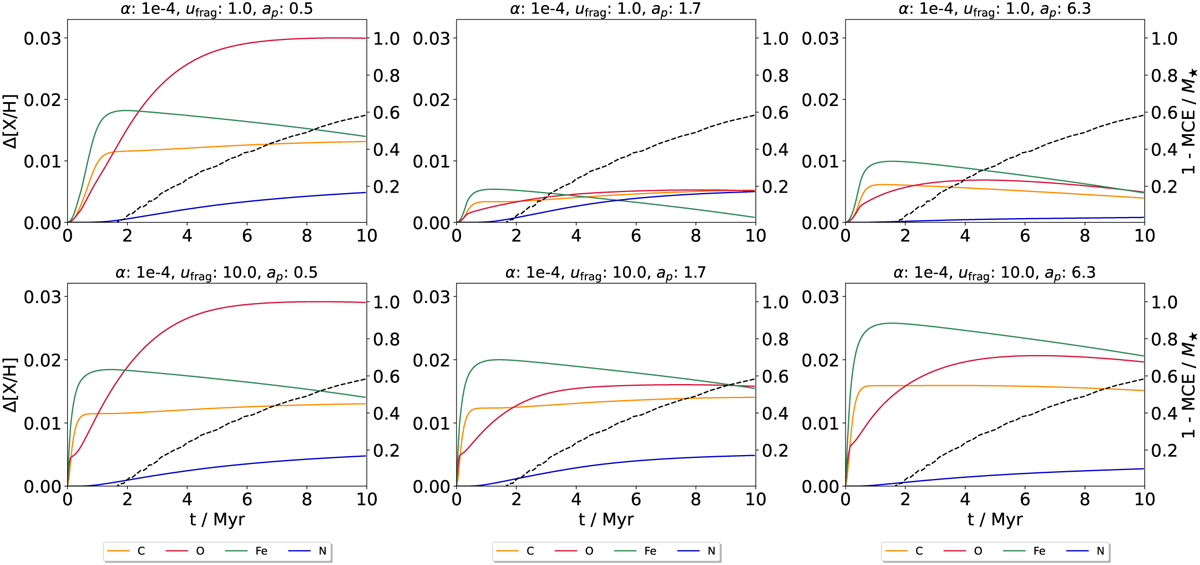
Same as Fig. 5, but now, a planet is included in the disk. The viscosity is kept constant, but ufrag is varied. Simulations where the planet was placed at three different locations are shown, relative to the Fe3O4, H2O and CO2 ice lines. Each column represents a different planet placement, with it being placed further out going from the left-most to the right-most column. The top row depicts disks with ufrag = 1 m s−1 and the bottom row those with ufrag = 10 m s−1.
Current usage metrics show cumulative count of Article Views (full-text article views including HTML views, PDF and ePub downloads, according to the available data) and Abstracts Views on Vision4Press platform.
Data correspond to usage on the plateform after 2015. The current usage metrics is available 48-96 hours after online publication and is updated daily on week days.
Initial download of the metrics may take a while.