Fig. 7.
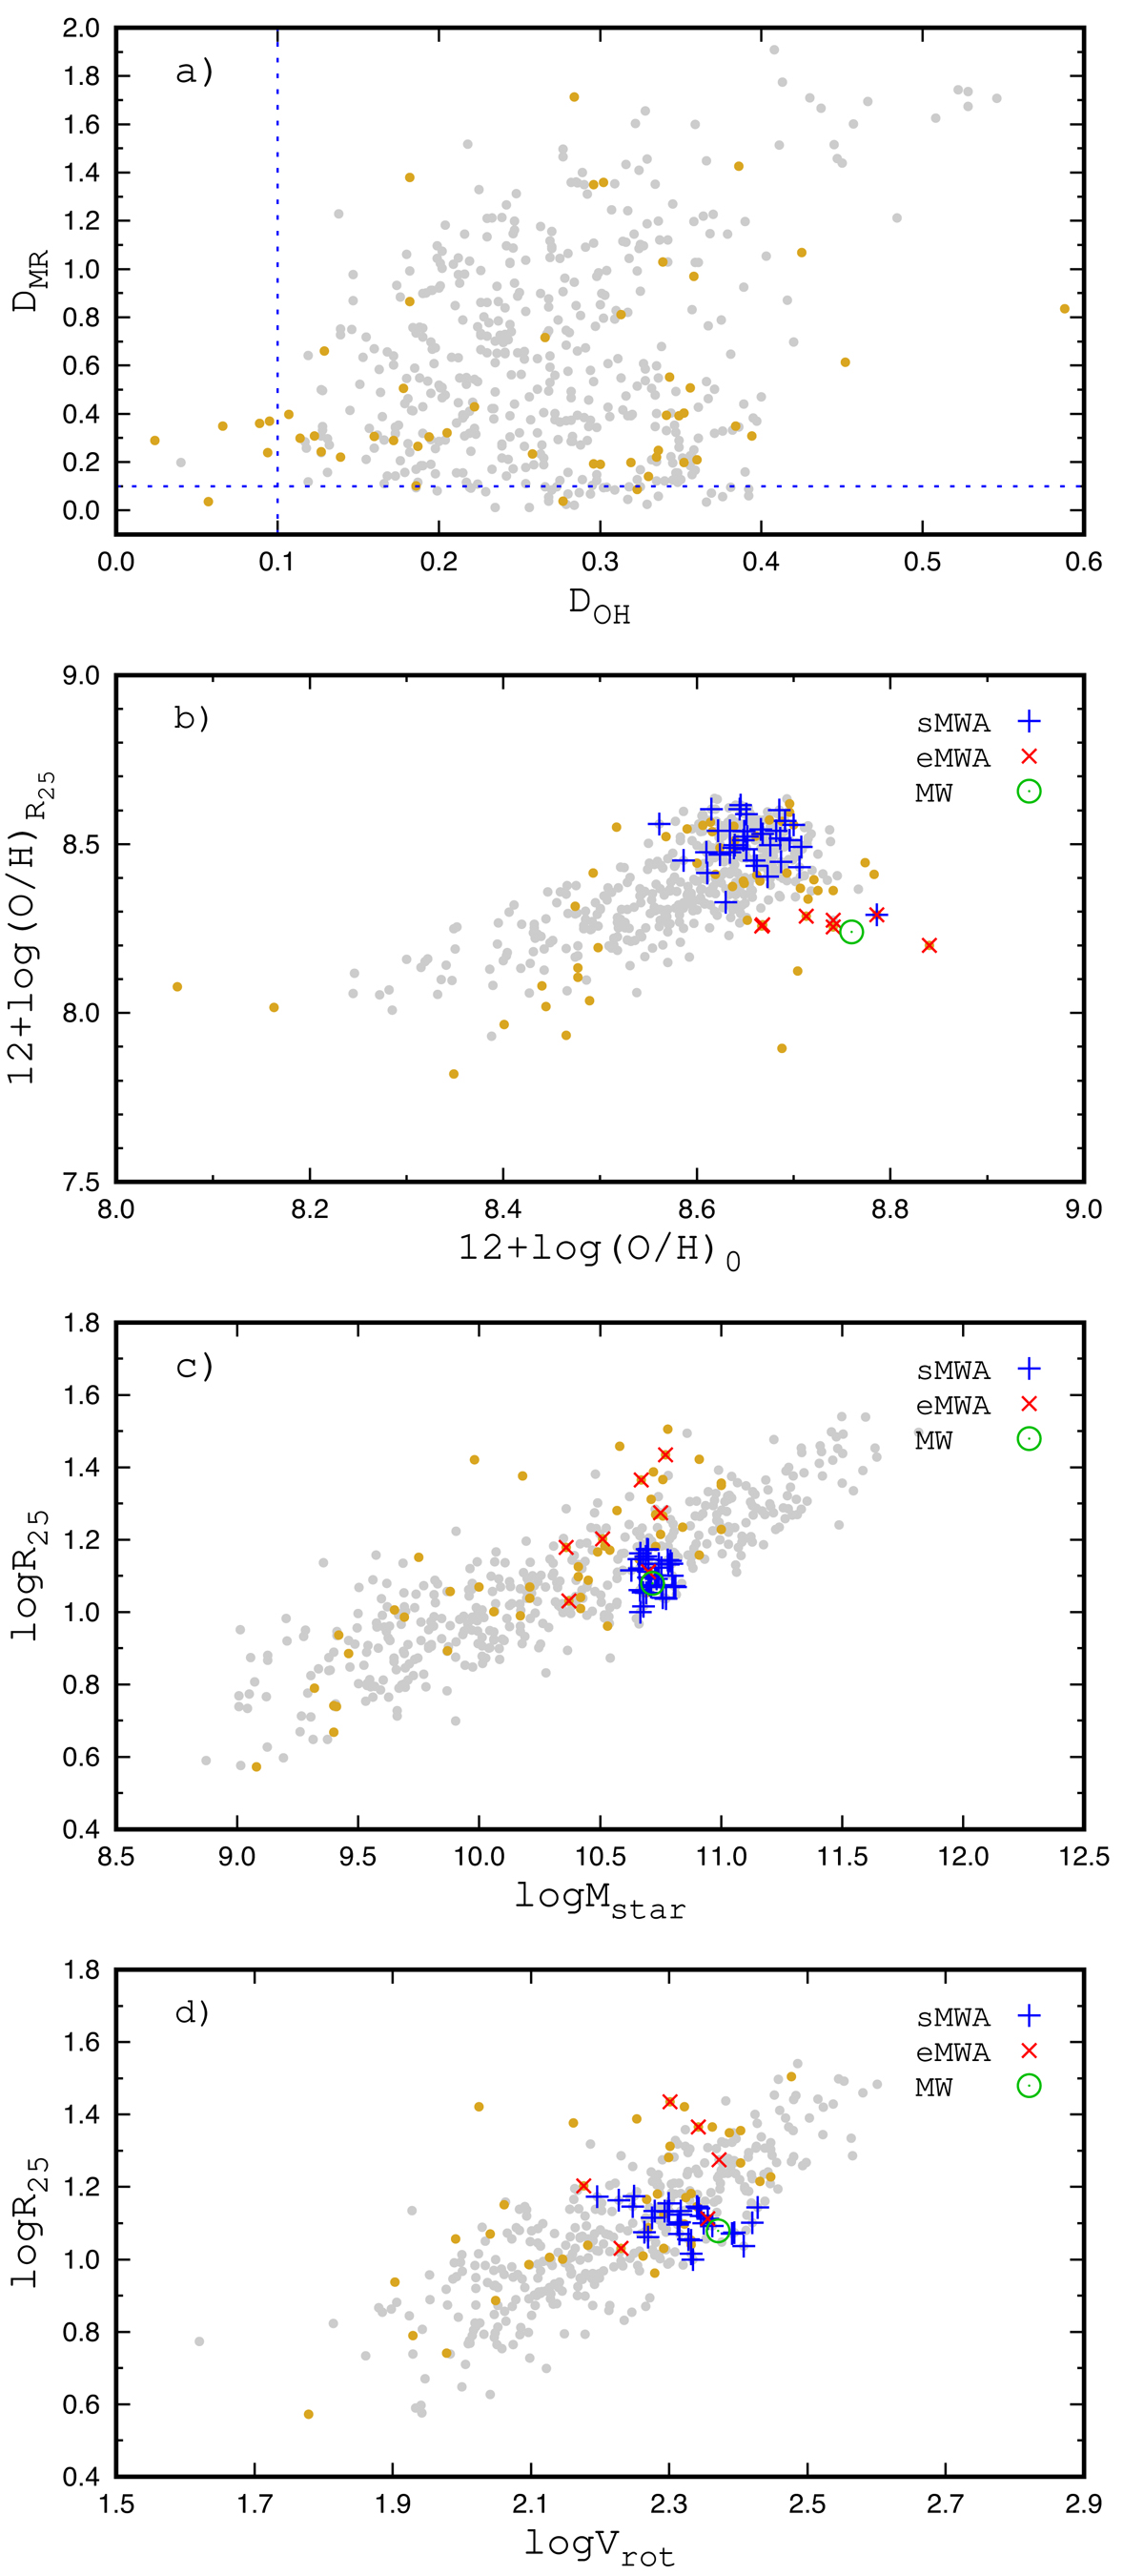
Download original image
Milky Way twin candidates according to the strict criteria. Panel a: index of the structural differences between galaxies and the Milky Way DMR (Eq. (10)) as a function of the index of the evolutionary difference DOH (Eq. (11)). The points are individual MaNGA (grey) and nearby (goldenrod) galaxies. The dashed lines indicate DMR = 0.1 and DOH = 0.1. Panel b: central oxygen abundance versus abundance at the optical radius. The galaxies with DOH ≤ 0.1 (eMWAs) are marked with red crosses. The galaxies with DMR < 0.1 (sMWAs) are indicated with blue plus signs. The green circle denotes the Milky Way. Panel c: optical radius versus stellar mass diagram. The notations are the same as in panel b. Panel d: optical radius versus rotation velocity diagram. The notations are the same as in panel b.
Current usage metrics show cumulative count of Article Views (full-text article views including HTML views, PDF and ePub downloads, according to the available data) and Abstracts Views on Vision4Press platform.
Data correspond to usage on the plateform after 2015. The current usage metrics is available 48-96 hours after online publication and is updated daily on week days.
Initial download of the metrics may take a while.