Fig. 9
Download original image
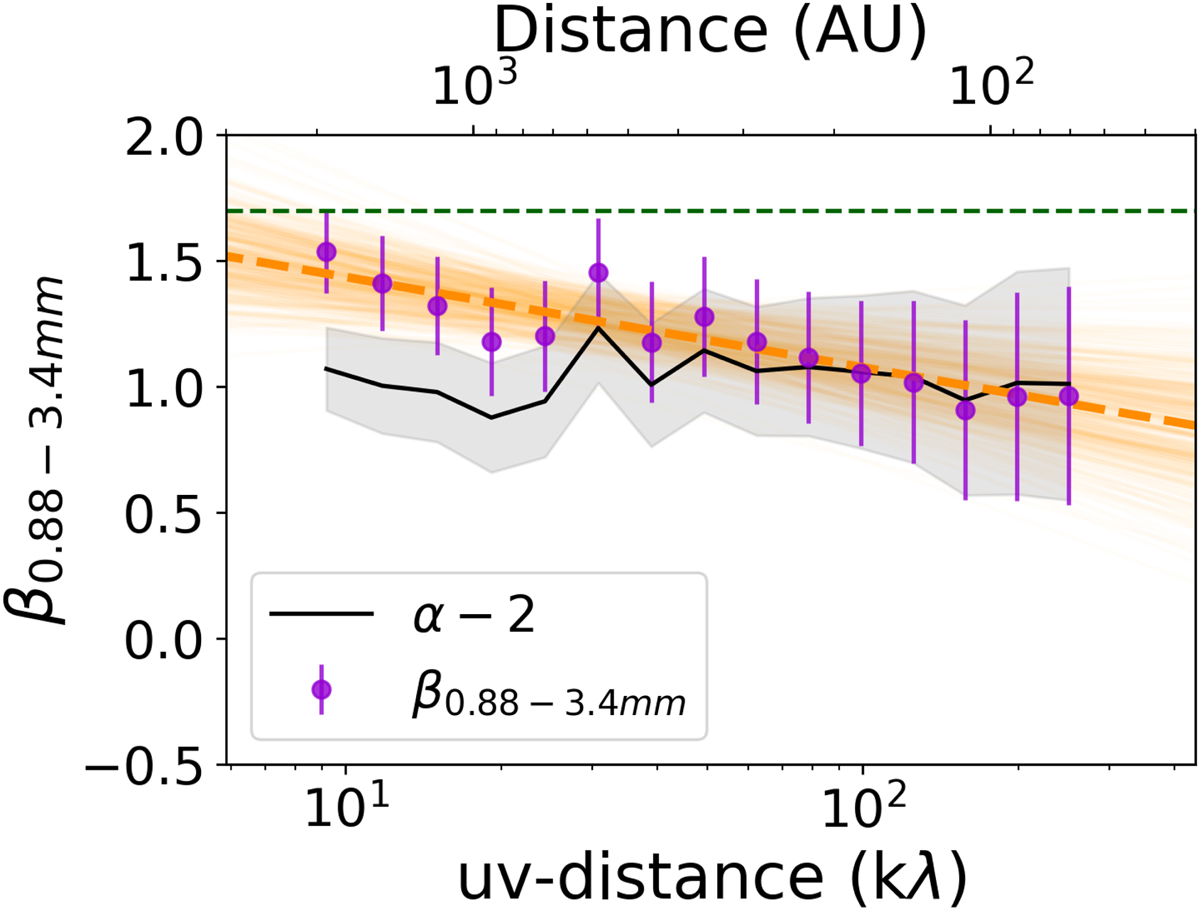
Dust emissivity index (purple dots) of the envelope of L1527 as a function of radial scales. The solid dots indicate the β computed fitting all available bands. The dashed orange line is the best model for the profile of β along scales, while the light orange lines are a subsample of the results of some chains of the fitting procedure. The black line shows the approximation in which β = αfit − 2, where α is the slope of the SED considering all available bands.
Current usage metrics show cumulative count of Article Views (full-text article views including HTML views, PDF and ePub downloads, according to the available data) and Abstracts Views on Vision4Press platform.
Data correspond to usage on the plateform after 2015. The current usage metrics is available 48-96 hours after online publication and is updated daily on week days.
Initial download of the metrics may take a while.