Fig. 7
Download original image
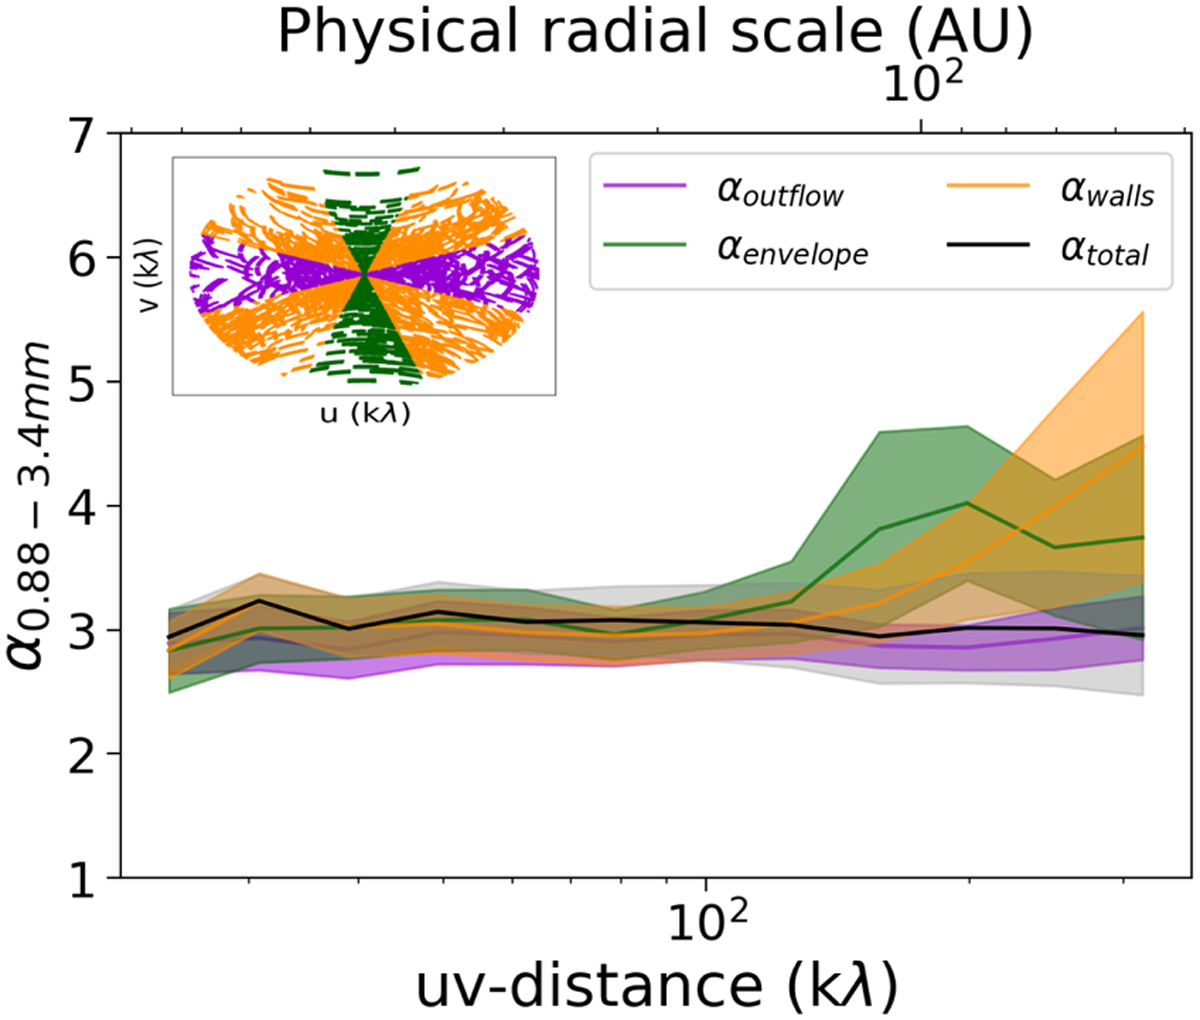
Spectral index of L1527 as measured along directions of the outflow (violet) and envelope (green), cavity walls (orange). The total α is also plotted (gray). The way the uv-coverage has been sampled is shown in the upper inset (B7 as an example). The scarce uv-coverage of the ACA B7 observations cause some bins to be undefined at the short baselines, hence the gaps. In all cases, α is only computed starting from 20 kλ.
Current usage metrics show cumulative count of Article Views (full-text article views including HTML views, PDF and ePub downloads, according to the available data) and Abstracts Views on Vision4Press platform.
Data correspond to usage on the plateform after 2015. The current usage metrics is available 48-96 hours after online publication and is updated daily on week days.
Initial download of the metrics may take a while.