Fig. 3
Download original image
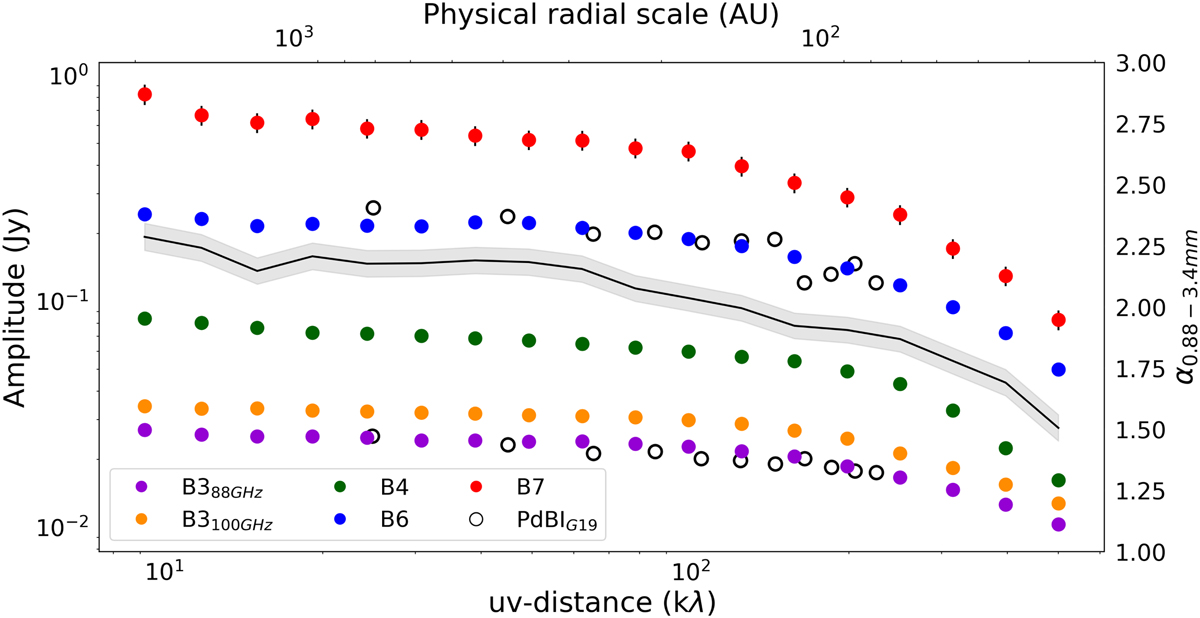
L1527 ALMA 88 GHz (purple), 100 GHz (orange), 141 GHz (green), 249 GHz (blue), 348 GHz (red) visibility amplitudes up to 1000 kλ. We also compare the 94 and 231 GHz observations (white points) performed with the Plateau de Bure Interferometer (PdBI) and anlayzed in Galametz et al. (2019). The slope of our observed Spectral Energy Distribution (black line) has been obtained by fitting a line to the fluxes at all wavelengths in each uv-distance bin. While 1.5 < αfit < 2.5, most of the contribution to the flux – and to α – at any uv-distance is due to the disk (see Sect. 4).
Current usage metrics show cumulative count of Article Views (full-text article views including HTML views, PDF and ePub downloads, according to the available data) and Abstracts Views on Vision4Press platform.
Data correspond to usage on the plateform after 2015. The current usage metrics is available 48-96 hours after online publication and is updated daily on week days.
Initial download of the metrics may take a while.