Fig. 2
Download original image
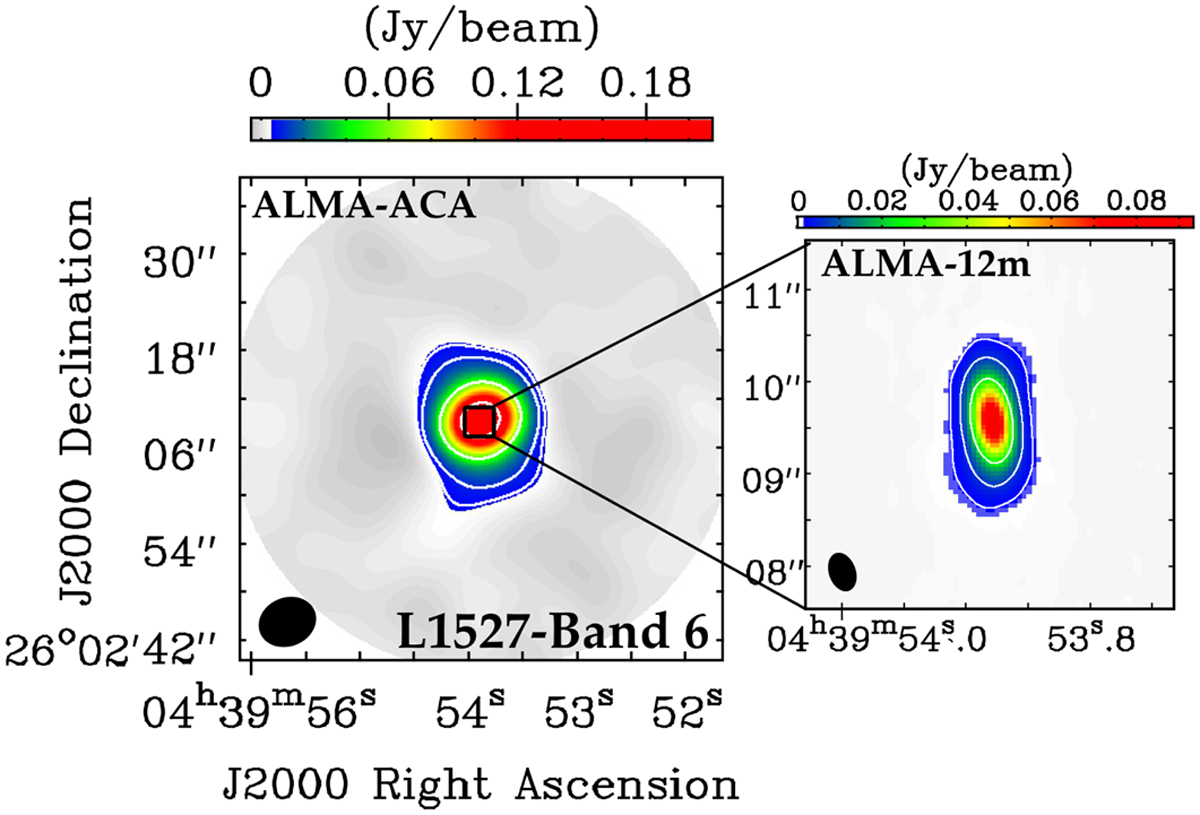
ALMA B6 continuum of map of L1527 obtained imaging the 7 m array setup of the FAUST Large Program. The inner 4″.0 inset has been imaged using ALMA B6 FAUST 12-m array setup data. The color map for the ACA image shows only flux densities higher than 5σ, and the white [5, 10, 50, 150]σ level contours. The color map of the 12-m array image shows only flux densities higher than 20σ, and the white [20,60,100]σ level contours. The synthesized beams are shown in black in the lower left corner in both cases. We note that the colorbar is different for each map.
Current usage metrics show cumulative count of Article Views (full-text article views including HTML views, PDF and ePub downloads, according to the available data) and Abstracts Views on Vision4Press platform.
Data correspond to usage on the plateform after 2015. The current usage metrics is available 48-96 hours after online publication and is updated daily on week days.
Initial download of the metrics may take a while.