Open Access
Fig. C.1
Download original image
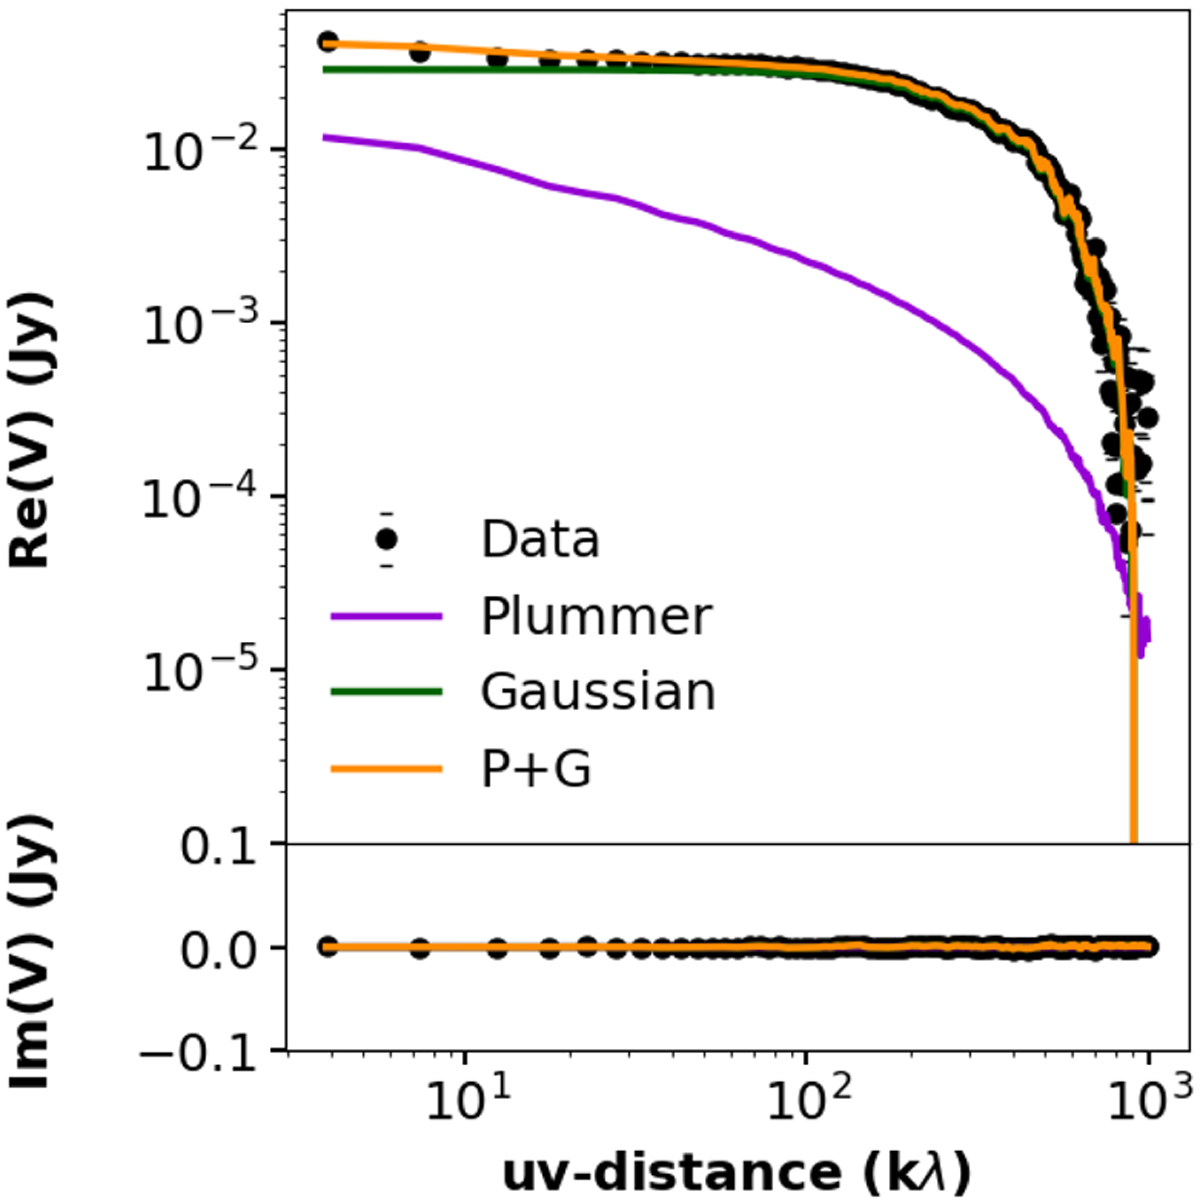
The galario fit of the B3 (100 GHz) real and imaginary part of the visibilities. The best model (orange) is composed of a compact Gaussian model (green) and an outer power law (violet). The wiggles in the plotted model are due to its sampling on the uv points of the observations.
Current usage metrics show cumulative count of Article Views (full-text article views including HTML views, PDF and ePub downloads, according to the available data) and Abstracts Views on Vision4Press platform.
Data correspond to usage on the plateform after 2015. The current usage metrics is available 48-96 hours after online publication and is updated daily on week days.
Initial download of the metrics may take a while.