Open Access
Fig. 1
Download original image
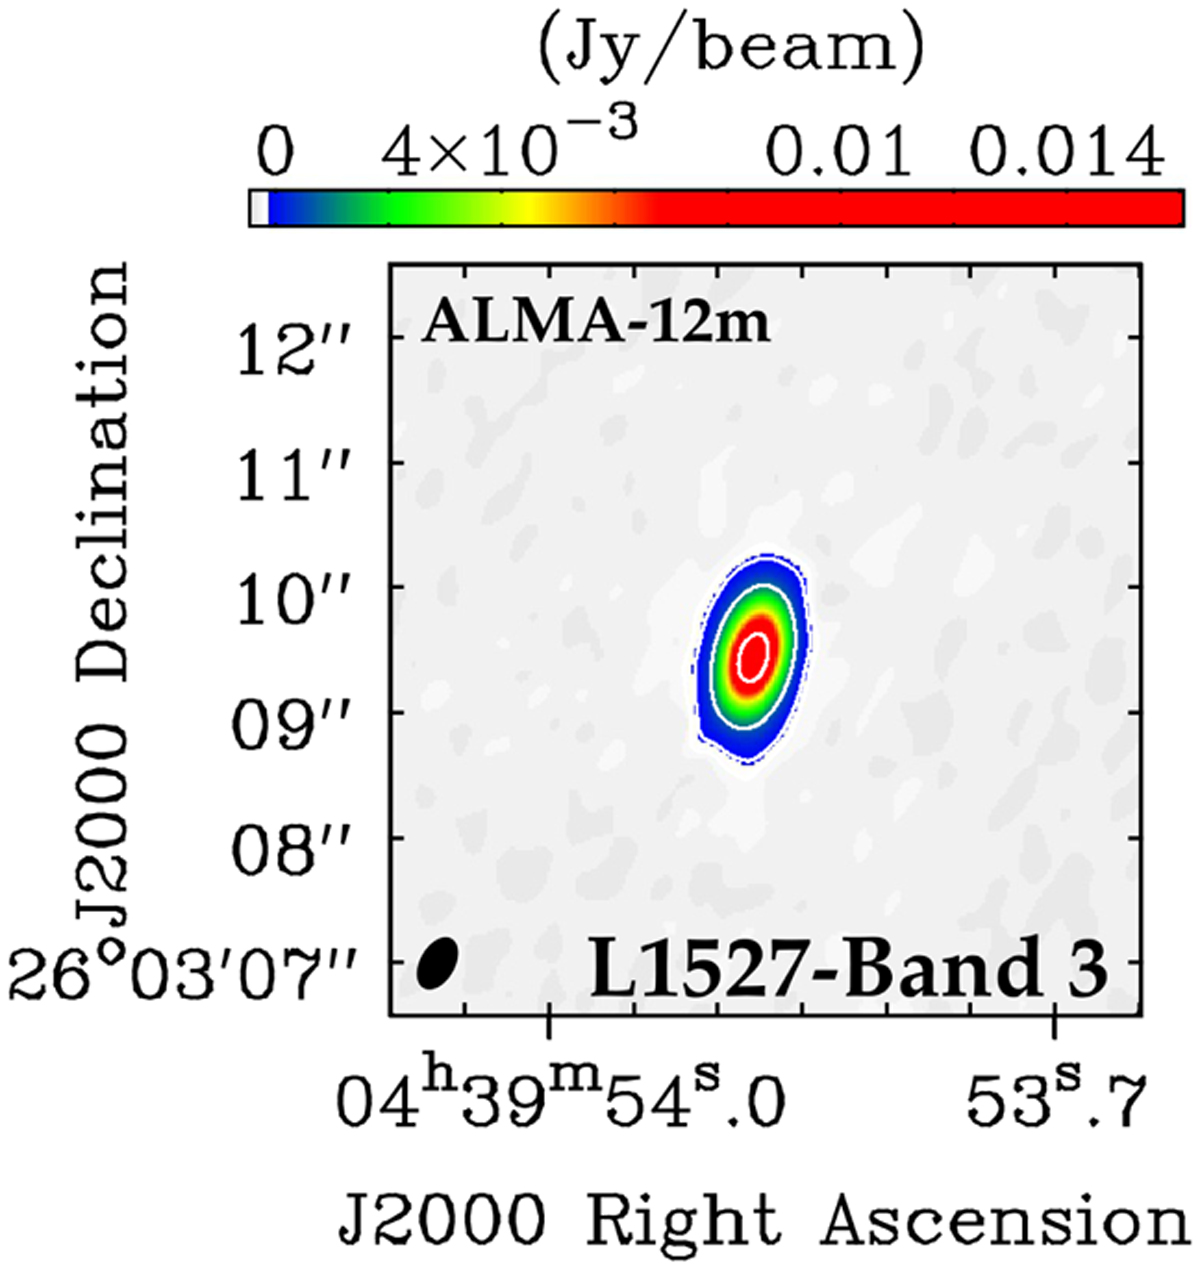
Zoom in to the inner 6″.0 of the ALMA B3 continuum of L1527 obtained with the 12-m array setups of the FAUST Large Program. The color map shows only flux densities higher than ~5σ, with the white contours highlighting the [5, 15, 30]σ levels. The ALMA synthesized beam is shown in black in the lower left corner.
Current usage metrics show cumulative count of Article Views (full-text article views including HTML views, PDF and ePub downloads, according to the available data) and Abstracts Views on Vision4Press platform.
Data correspond to usage on the plateform after 2015. The current usage metrics is available 48-96 hours after online publication and is updated daily on week days.
Initial download of the metrics may take a while.