Open Access
Fig. 1
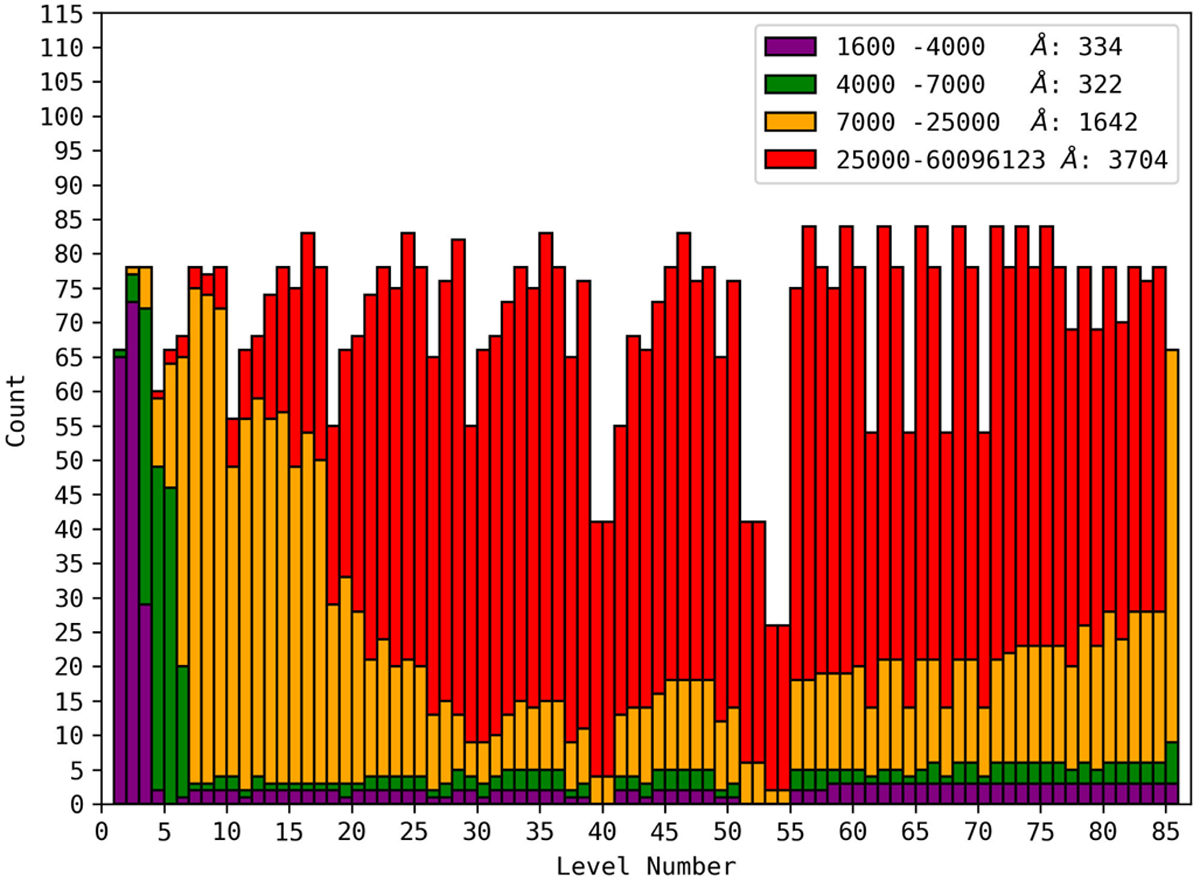
Download original image
Stacked histogram of the levels used by the 3001 radiative term-term transitions in the NLTE population calculation of model d. The purple bars represent the levels used at wavelengths in the FUV and NUV, the green bars in the visible range, the orange bars in the NIR, and the red bars from the MIR to the FIR.
Current usage metrics show cumulative count of Article Views (full-text article views including HTML views, PDF and ePub downloads, according to the available data) and Abstracts Views on Vision4Press platform.
Data correspond to usage on the plateform after 2015. The current usage metrics is available 48-96 hours after online publication and is updated daily on week days.
Initial download of the metrics may take a while.