Fig. 8.
Download original image
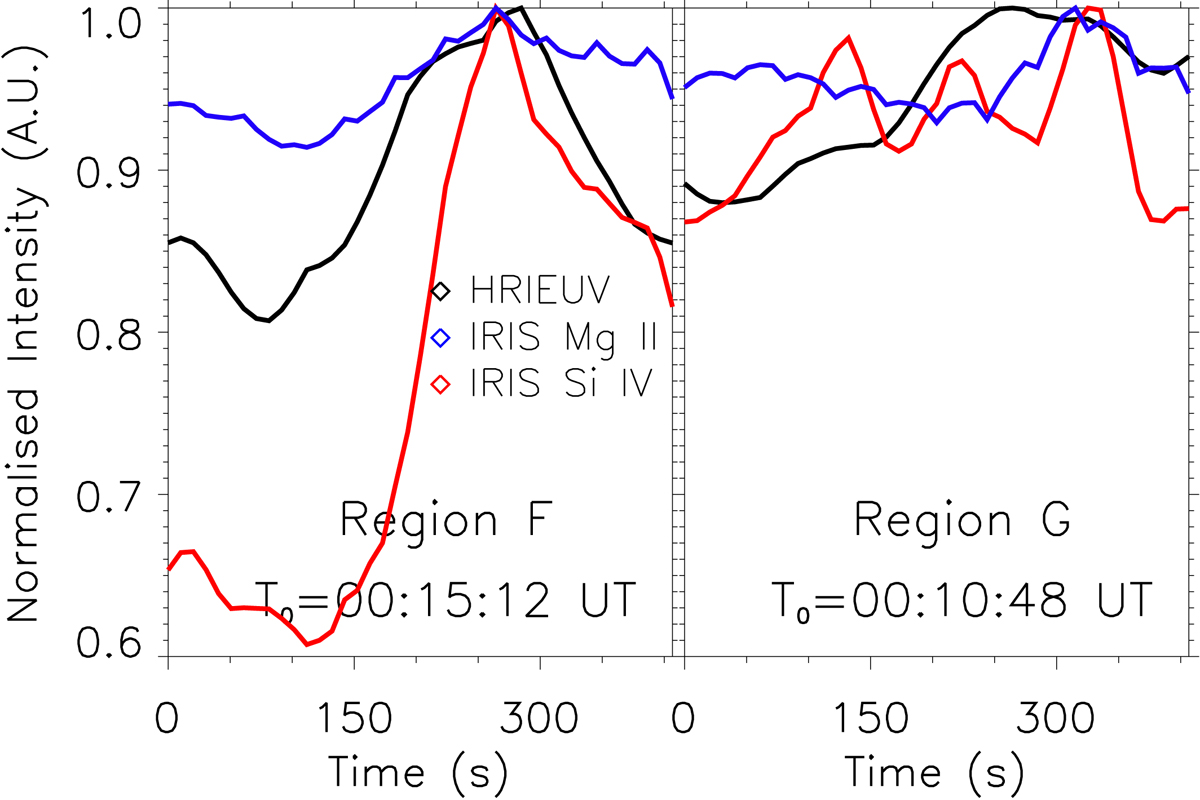
Light curves of the mean intensity around two regions of complex EUV brightening activity within regions F (left panel) and G (right panel). Again, the black lines plot light curves constructed from the HRIEUV data, and the blue and red lines plot light curves constructed using the IRIS Mg II 279.6 nm and Si IV 140 nm SJI filters, respectively. The left panel plots the light curves constructed from a small box (similar to those discussed in Fig. 4) around the event plotted in Fig. 7. The HRIEUV intensity is found to peak co-temporally with the increased emission in both IRIS SJI filters for the left panel. For the right panel, however, several short bursts (lifetimes of the order of seconds) are evident in the IRIS Si IV 140 nm intensity during the occurrence of the EUV brightening. The time defined as t = 0 s is overlaid on each panel.
Current usage metrics show cumulative count of Article Views (full-text article views including HTML views, PDF and ePub downloads, according to the available data) and Abstracts Views on Vision4Press platform.
Data correspond to usage on the plateform after 2015. The current usage metrics is available 48-96 hours after online publication and is updated daily on week days.
Initial download of the metrics may take a while.