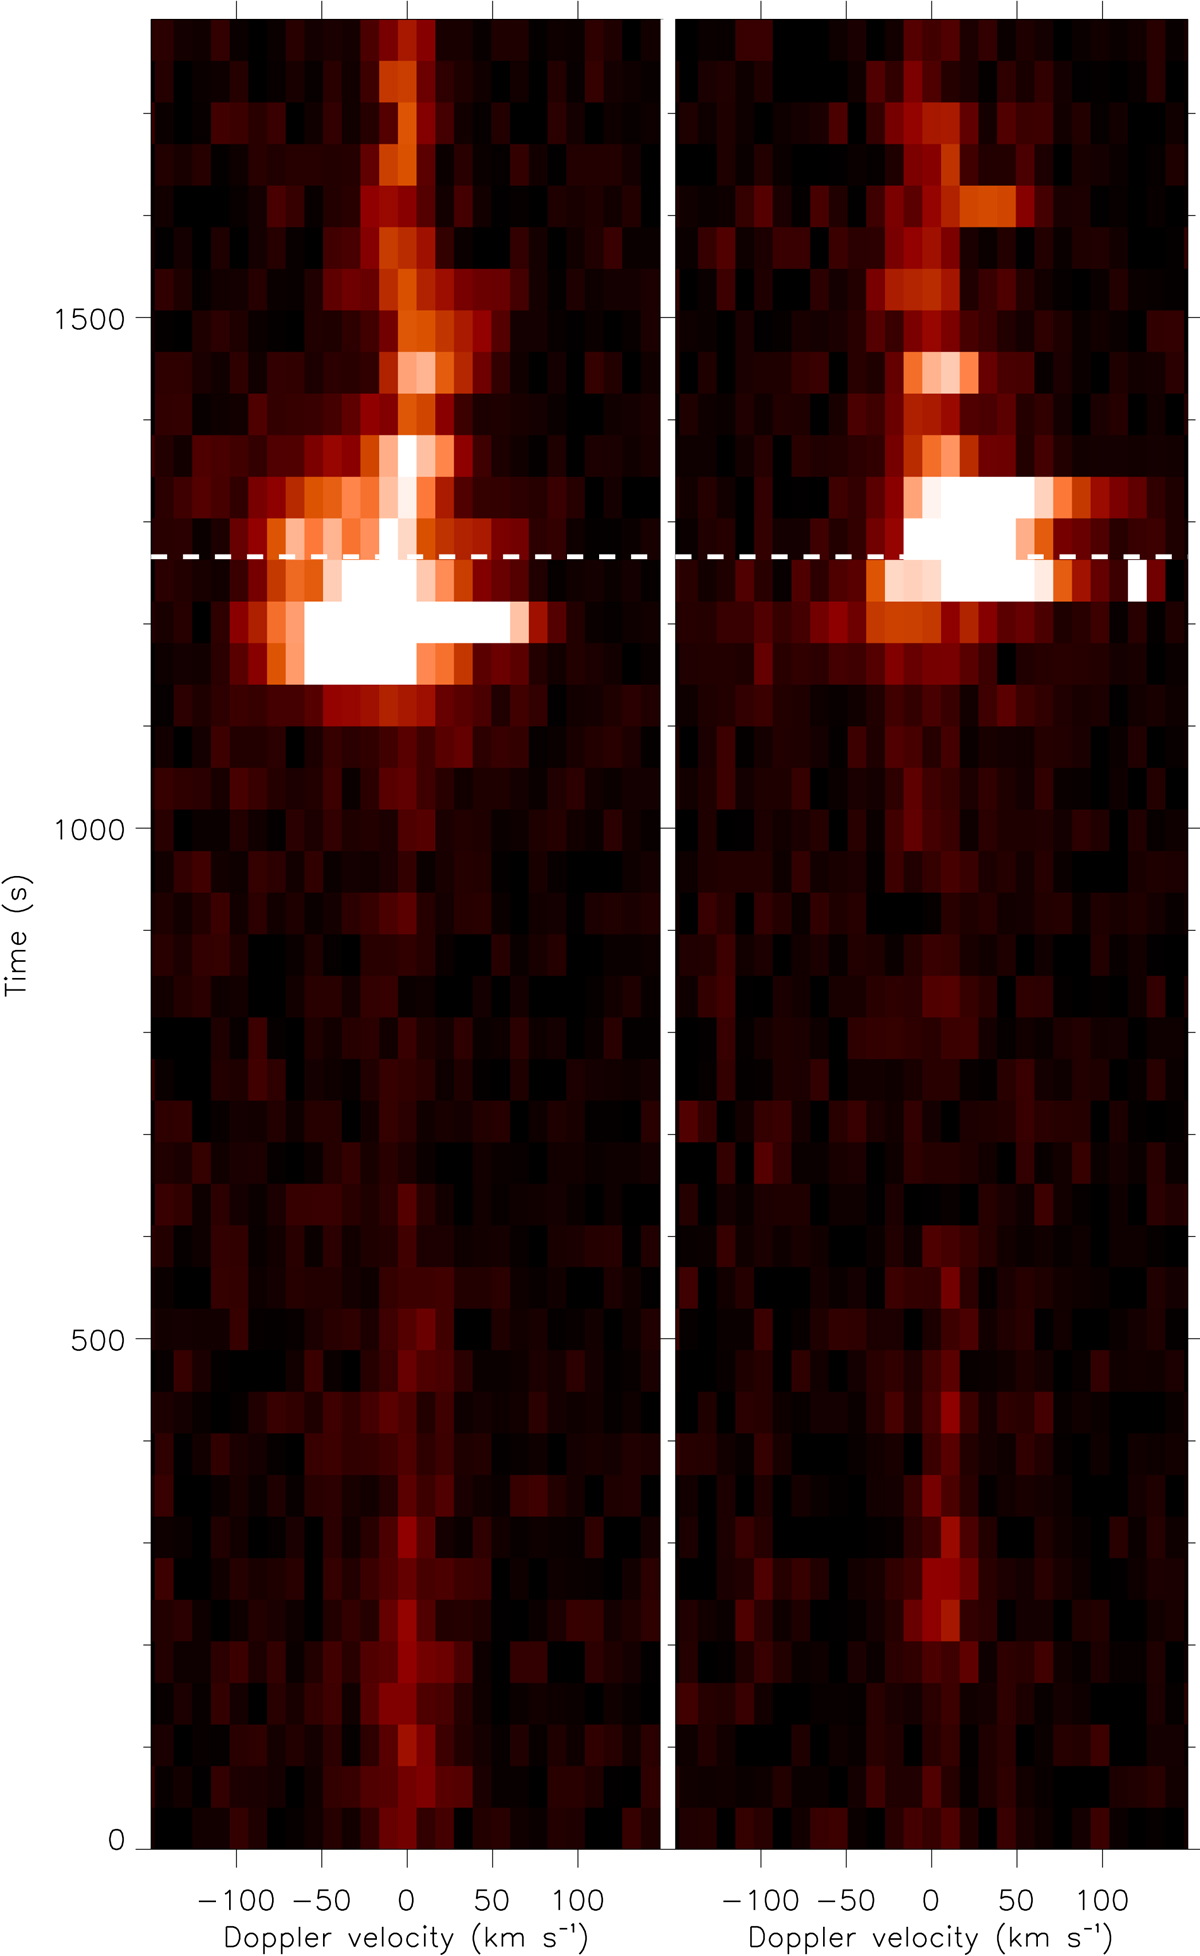
Fig. 6.
Download original image
Spectral-time maps constructed from the Si IV 139.4 nm line for the two pixels (the left panel corresponds to the purple crosses, and the right panel corresponds to the green crosses) plotted in Fig. 5. The dashed horizontal white lines indicate the time-step plotted in that figure. The clear blue- and red-shifts measured at either end of the EUV brightening from the spectra are evident at multiple time-steps throughout the evolution of this apparent EE.
Current usage metrics show cumulative count of Article Views (full-text article views including HTML views, PDF and ePub downloads, according to the available data) and Abstracts Views on Vision4Press platform.
Data correspond to usage on the plateform after 2015. The current usage metrics is available 48-96 hours after online publication and is updated daily on week days.
Initial download of the metrics may take a while.