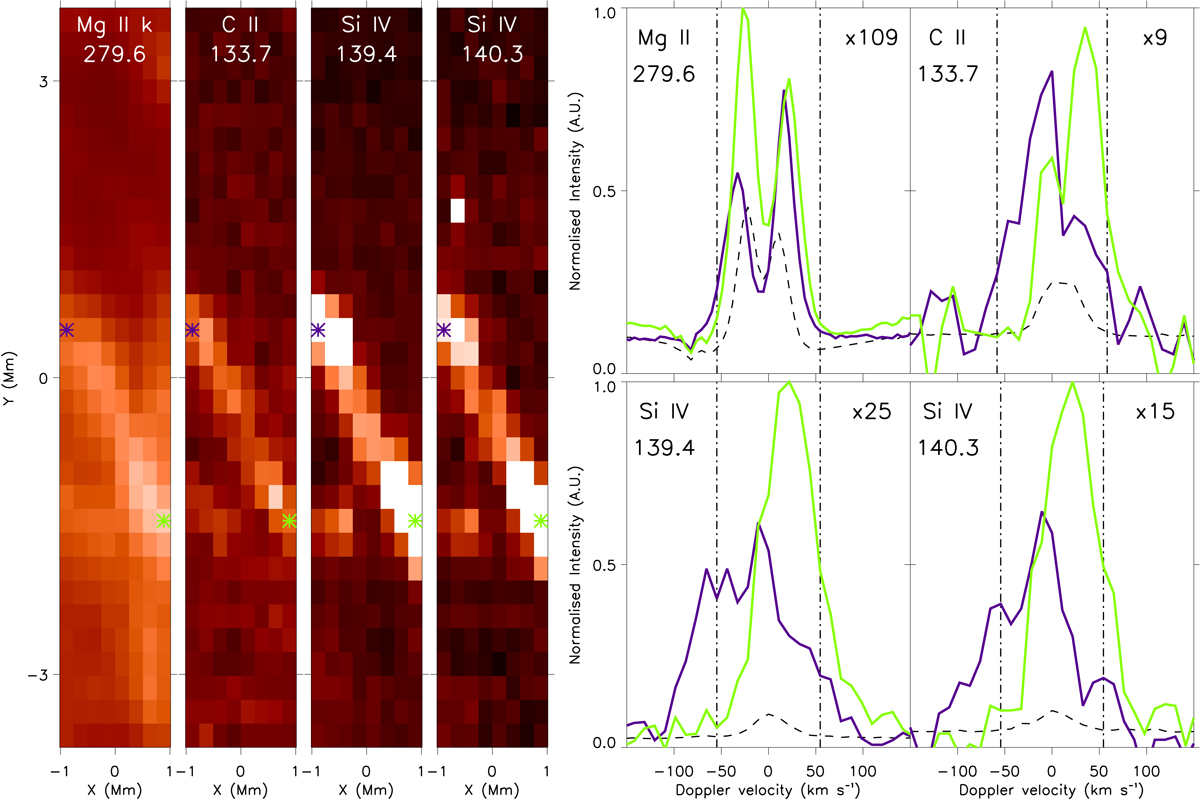
Fig. 5.

Download original image
Spectral response to the extended EUV brightening plotted in Fig. 3 as sampled at 00:25:21 UT. The left four panels plot the integrated intensity over 110 km s−1 Doppler velocity windows around the rest wavelength for the Mg II 279.6 nm (first panel), C II 133.7 nm (second panel), Si IV 139.4 nm (third panel), and Si IV 140.3 nm (fourth panel) spectral lines. The four panels on the right plot the spectra sampled at the positions of the coloured crosses in the left panels (within the first and last raster positions). The dashed black lines plot the average spectra calculated from this raster, whilst the two vertical dot-dashed lines book-end the Doppler velocity windows integrated across to construct the left panels. Each spectral profile has been normalised against the peak value (DN/s) from these three spectra. The normalisation factor is printed in the top right corner. The spectra are slightly blue-shifted (-22 km s−1; calculated from a single-Gaussian fit to the Si IV 139.4 nm line) at the left side of the FOV (purple spectra), and they are slightly red-shifted (+22 km s−1; calculated from a single-Gaussian fit to the Si IV 139.4 nm line) at the right side of the FOV (green spectra).
Current usage metrics show cumulative count of Article Views (full-text article views including HTML views, PDF and ePub downloads, according to the available data) and Abstracts Views on Vision4Press platform.
Data correspond to usage on the plateform after 2015. The current usage metrics is available 48-96 hours after online publication and is updated daily on week days.
Initial download of the metrics may take a while.


