Fig. 4.
Download original image
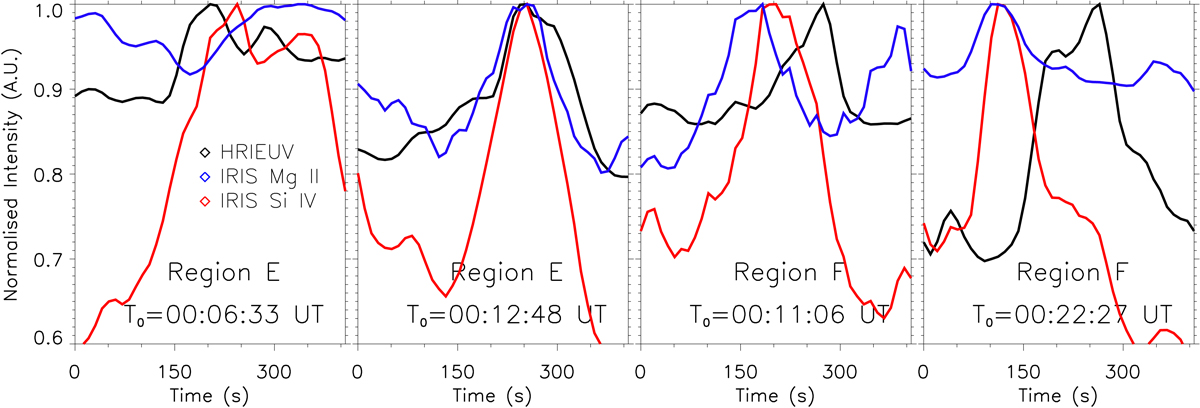
Light curves of the mean intensity around four extended EUV brightening within regions E and F. The black lines plot light curves constructed from the HRIEUV data, and the blue and red lines plot light curves constructed using the IRIS Mg II 279.6 nm and Si IV 140 nm SJI filters, respectively. The left two panels plot light curves constructed from small boxes (the sizes of which were close to 1.8 Mm2, with the exact dimensions being varied to encompass the different orientations of individual EUV brightenings and any co-spatial associated brightenings in IRIS data) around two EUV brightenings within region E. The first panel corresponds to the event plotted in Fig. 2. The right two panels plot light curves constructed from small boxes (like those constructed for region E) around two EUV brightenings within region F. The fourth panel corresponds to the event plotted in Fig. 3. The HRIEUV intensity is found to peak before (first panel), co-temporally with (second panel), and after (third and fourth panels) the IRIS Si IV SJI 140 nm SJI filter intensity for different events. Clear brightening events are also found in the Mg II 279.6 nm filters for the rightmost three of these four events. The time defined as t = 0 s is overlaid on each panel.
Current usage metrics show cumulative count of Article Views (full-text article views including HTML views, PDF and ePub downloads, according to the available data) and Abstracts Views on Vision4Press platform.
Data correspond to usage on the plateform after 2015. The current usage metrics is available 48-96 hours after online publication and is updated daily on week days.
Initial download of the metrics may take a while.