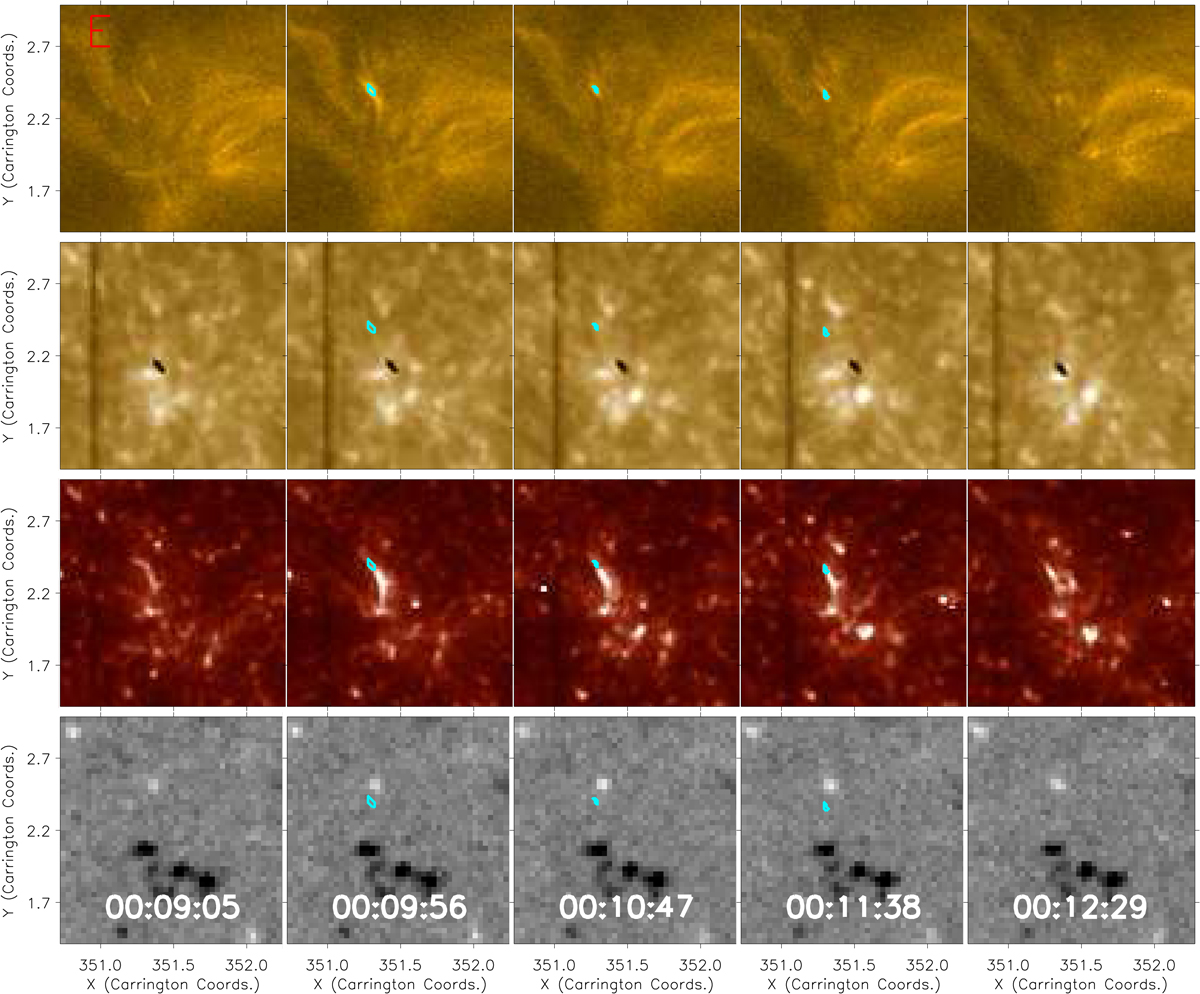
Fig. 2.
Download original image
Example of an extended EUV brightening from region E. The top row plots the HRIEUV intensity at five time-steps over the course of around 204 s. The EUV brightening activity is outlined by the cyan contours. The second row plots the co-spatial and co-temporal IRIS Mg II 279.6 nm filter SJI response (the dark spot in the centre of the images is a known blemish in the filter), while the third row plots the equivalent, but for the Si IV 140 nm filter. A clear brightening is evident in the Si IV 140 nm channel with a similar shape to, but extending slightly further to the south from, the EUV brightening in the HRIEUV data. The bottom row plots the line-of-sight photospheric magnetic field at this location as sampled by the SDO/HMI instrument. An animation of this region is available online.
Current usage metrics show cumulative count of Article Views (full-text article views including HTML views, PDF and ePub downloads, according to the available data) and Abstracts Views on Vision4Press platform.
Data correspond to usage on the plateform after 2015. The current usage metrics is available 48-96 hours after online publication and is updated daily on week days.
Initial download of the metrics may take a while.