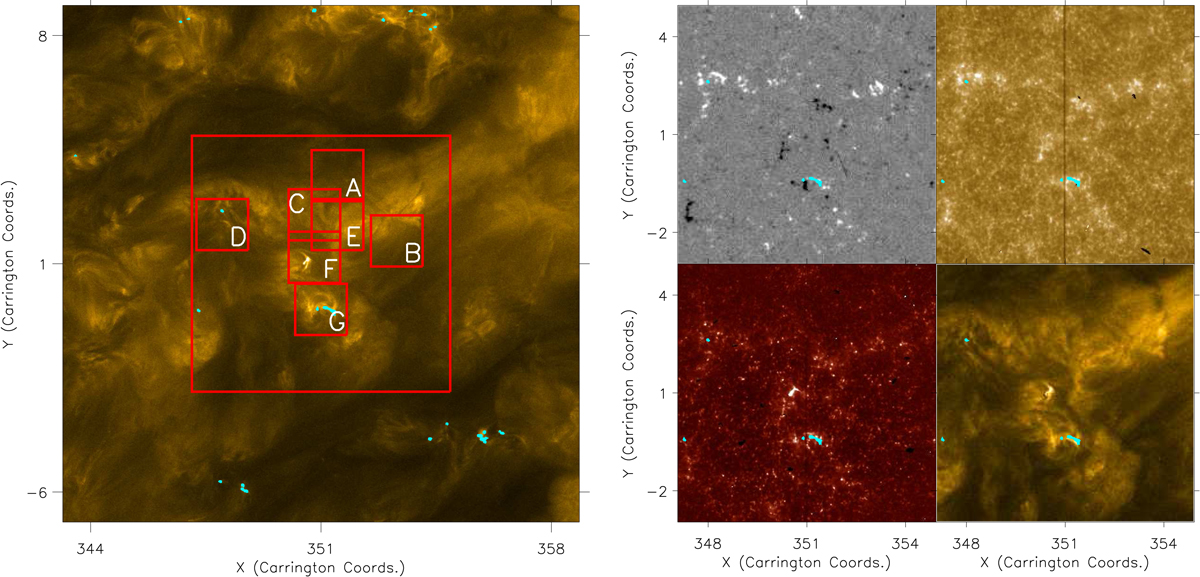
Fig. 1.
Download original image
Context image for the quiet-Sun region. In the left panel, we plot a zoom-in of the HRIEUV FOV observed at 00:04:21 UT on 8 March 2022. The larger red overlaid box outlines the IRIS FOV plotted in the right panels, whilst the smaller, labelled red boxes (corresponding to approximately 19.1 Mm × 19.1 Mm) outline the sub-FOVs that contained the EUV brightening activity. In the right panels, we plot the IRIS FOV as sampled by SDO/HMI line-of-sight magnetograms (top left), the IRIS Mg II 279.6 nm filter (top right), the IRIS Si IV 140 nm filter (bottom left), and the SDO/AIA 17.1 nm filter (bottom right). The cyan contours indicate the locations of EUV brightenings identified in the plotted HRIEUV frame.
Current usage metrics show cumulative count of Article Views (full-text article views including HTML views, PDF and ePub downloads, according to the available data) and Abstracts Views on Vision4Press platform.
Data correspond to usage on the plateform after 2015. The current usage metrics is available 48-96 hours after online publication and is updated daily on week days.
Initial download of the metrics may take a while.