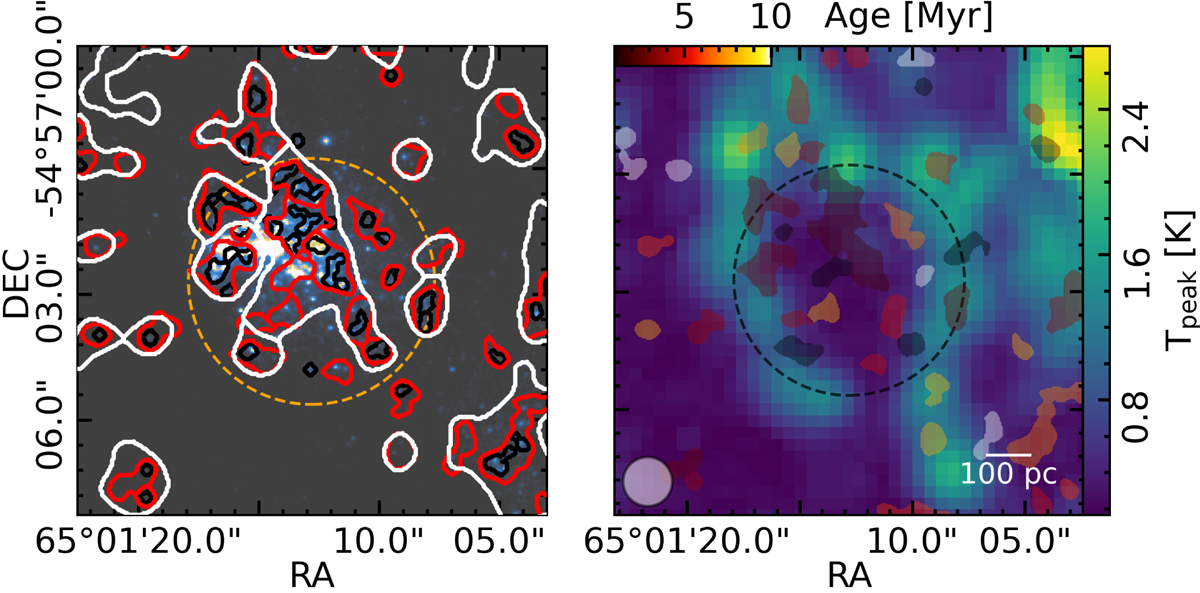
Fig. 8.
Download original image
Typical stellar associations, their overlap with superbubble features, and their appearance using bubble 36 from NGC 1566 as an example (see blue box in Fig. 1, panel 2). Left: HST B-band image with 16 pc (black contours), 32 pc (red), and 64 pc (white) association catalogues overlaid. Right: CO Tpeak map with the 32 pc associations overlaid coloured by their age. The filled translucent circle indicates the beam and the white line indicates a physical scale of 100 pc. The dashed orange and black circles show the bubble radius.
Current usage metrics show cumulative count of Article Views (full-text article views including HTML views, PDF and ePub downloads, according to the available data) and Abstracts Views on Vision4Press platform.
Data correspond to usage on the plateform after 2015. The current usage metrics is available 48-96 hours after online publication and is updated daily on week days.
Initial download of the metrics may take a while.