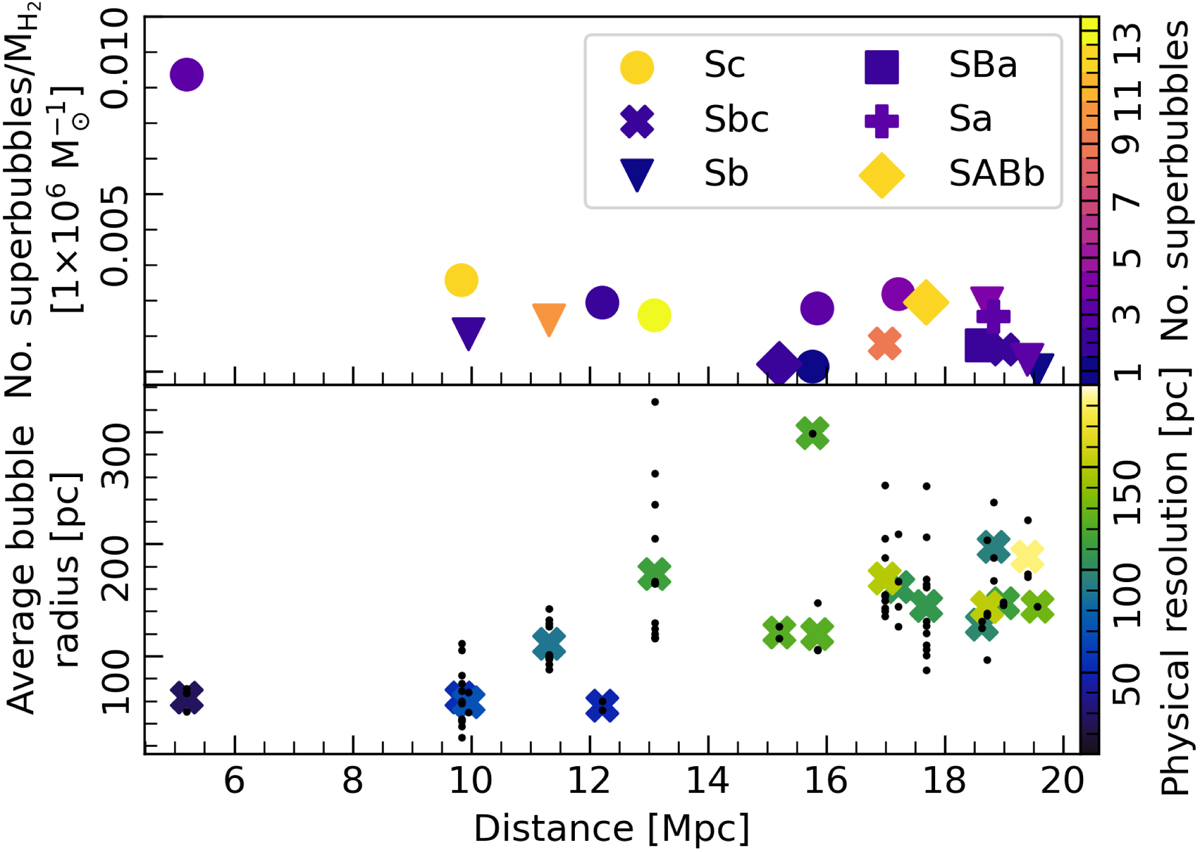
Fig. 6.
Download original image
Scatter plots indicating the impact of the resolution on the number of superbubbles found per galaxy. Top: number of superbubbles detected per galaxy normalised by the galaxy’s molecular mass as a function of distance. The marker shape indicates galaxy type (see legend). The colour of the markers shows the number of bubbles detected. Bottom: mean bubble radius (crosses) per galaxy. The black dots above and below the mean radius shows the individual radii found per galaxy. The colour of the markers shows the physical resolution of the CO data.
Current usage metrics show cumulative count of Article Views (full-text article views including HTML views, PDF and ePub downloads, according to the available data) and Abstracts Views on Vision4Press platform.
Data correspond to usage on the plateform after 2015. The current usage metrics is available 48-96 hours after online publication and is updated daily on week days.
Initial download of the metrics may take a while.