Open Access
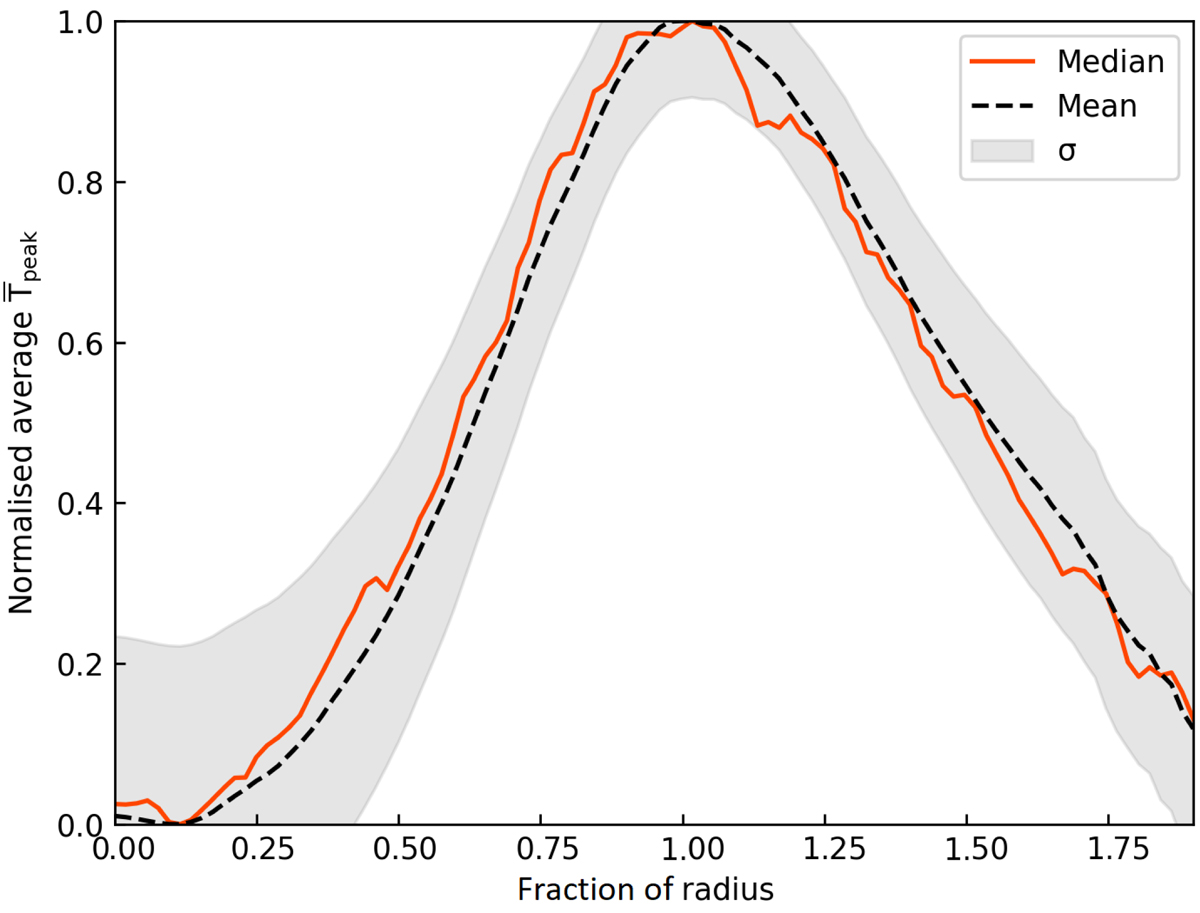
Fig. 3.
Download original image
Averaged normalised intensity profile of bubbles categorised as Closed Rings. The solid red line shows the mean profile, the dashed black line shows the median profile, and the filled grey region shows the statistical spread of the data measured using the standard deviation (σ).
Current usage metrics show cumulative count of Article Views (full-text article views including HTML views, PDF and ePub downloads, according to the available data) and Abstracts Views on Vision4Press platform.
Data correspond to usage on the plateform after 2015. The current usage metrics is available 48-96 hours after online publication and is updated daily on week days.
Initial download of the metrics may take a while.