Fig. 1.
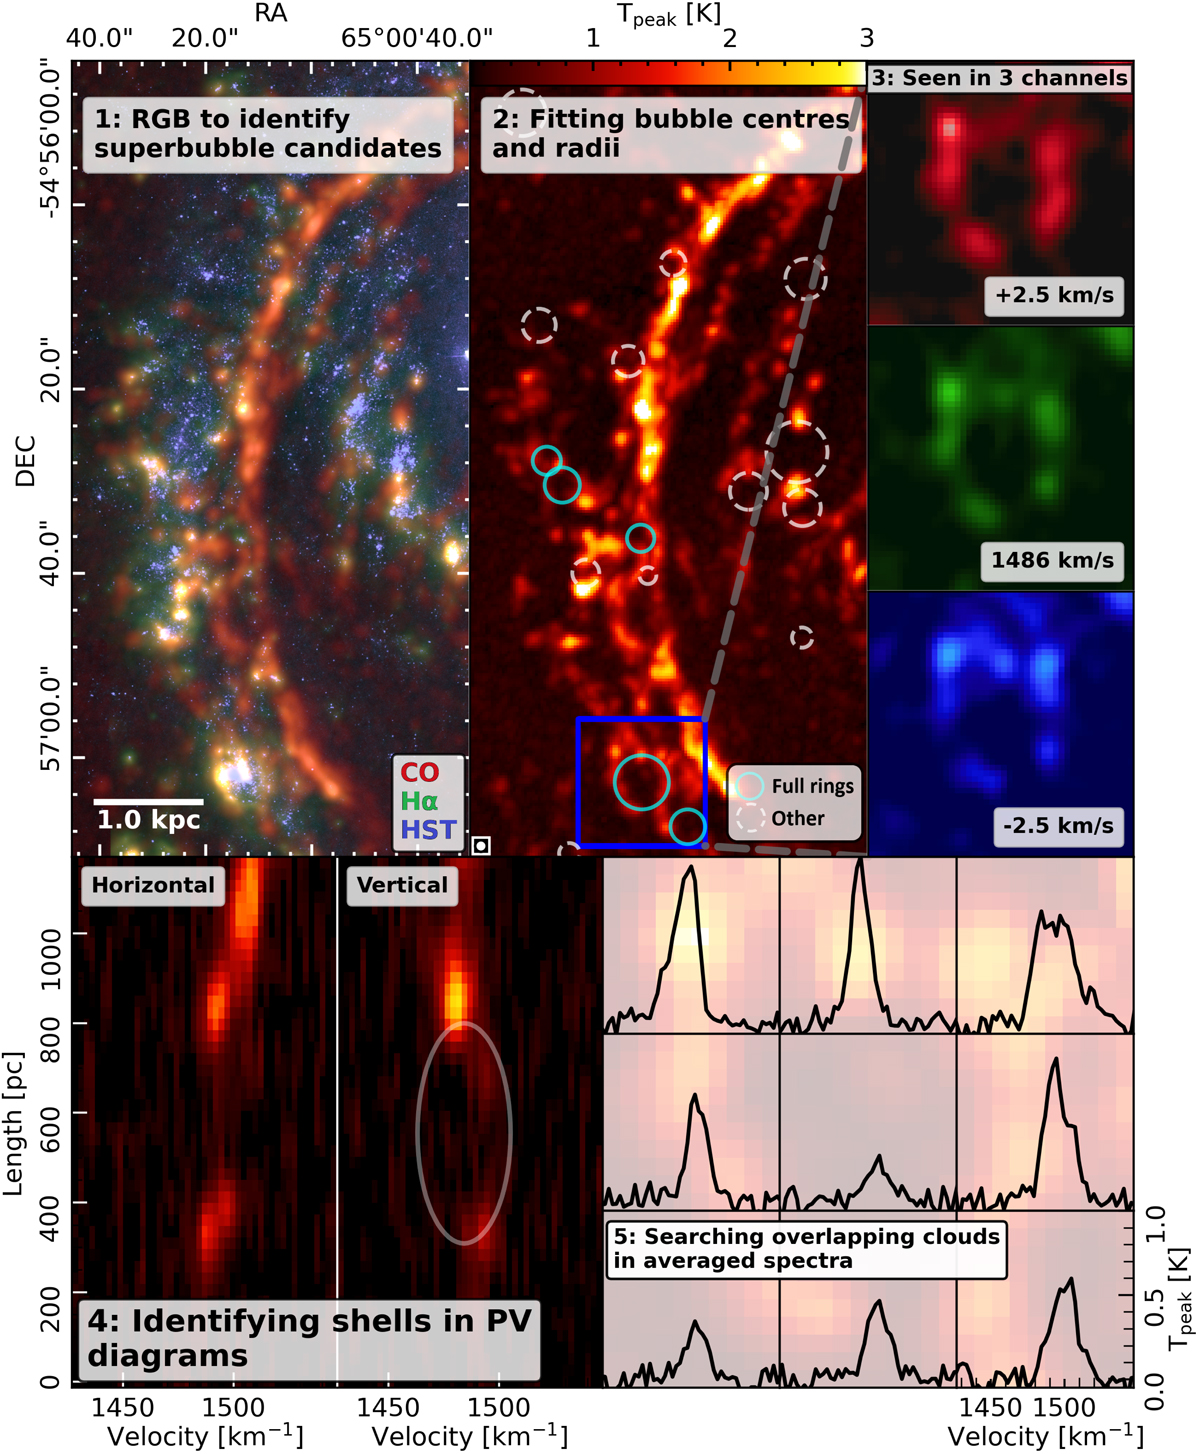
Download original image
Illustrating bubble identification and elimination criteria in section of NGC 1566. 1: CO Tpeak (red), Hα (green), and HST B-band (blue) combined into a false-colour image at their original resolution to identify superbubbles using multi-wavelength information. 2: Manually fitting radii and their centres using the CO Tpeak map. The cyan and dashed white circles show catalogued bubbles that were analysed or ignored, respectively. The blue box outlines the bubble examined in all remaining panels (Bubble 36 in Table 2). 3: Investigating the emission across three neighbouring channels in CO to confirm if bubble emission is significant in multiple consecutive velocity bands. If not, the bubble is removed from the sample. 4: Horizontal and vertical PV diagrams to confirm that expansion signature is present. The grey ellipse shows the present expansion signature. If unconfirmed, the bubble is removed. 5: Illustrating average spectra around the bubble. If identifiable background or foreground emission is found, the bubble is removed. All spectra shown here are free of contaminating emission.
Current usage metrics show cumulative count of Article Views (full-text article views including HTML views, PDF and ePub downloads, according to the available data) and Abstracts Views on Vision4Press platform.
Data correspond to usage on the plateform after 2015. The current usage metrics is available 48-96 hours after online publication and is updated daily on week days.
Initial download of the metrics may take a while.