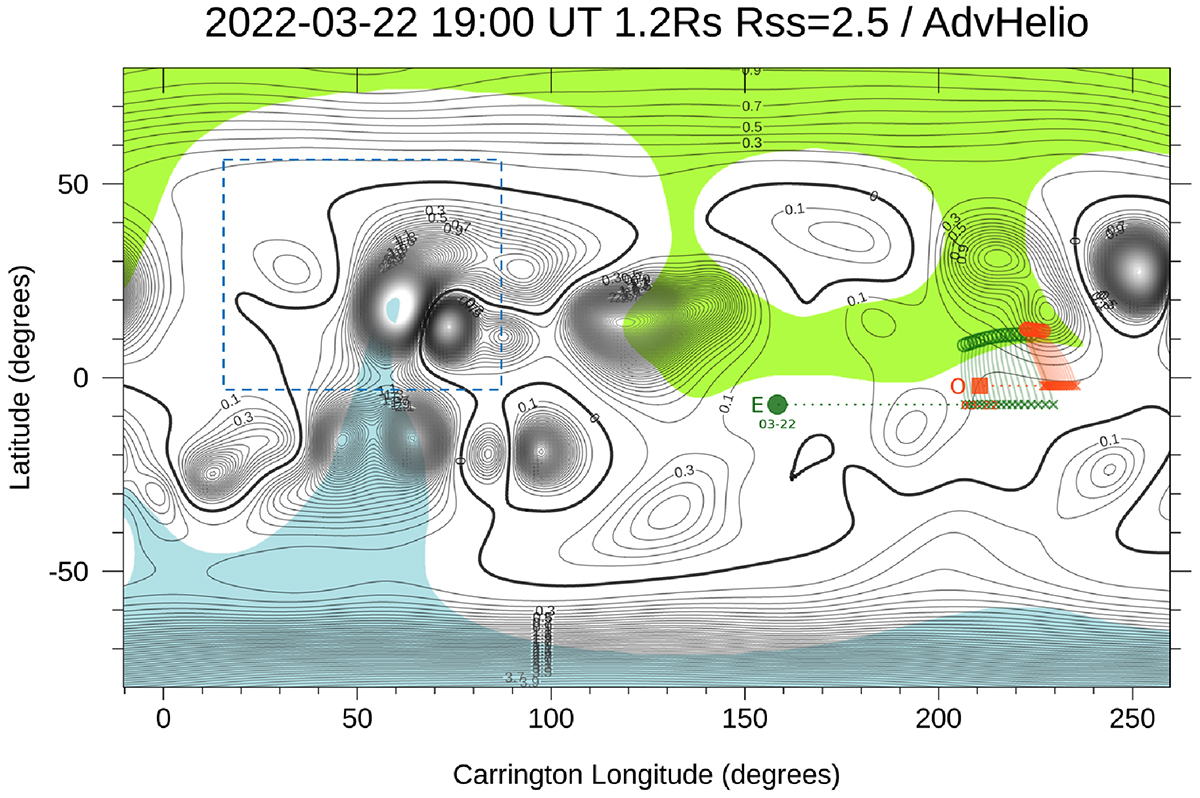
Fig. 9.
Download original image
Magnetic pressure (B2) contour map for 2022 March 22 based on the SDO/HMI magnetograms. The region from which the CME of March 22 originated is outlined by the dashed blue rectangular between 10 Å and 90 Å Carrington longitude. A PFSS model maps the magnetic connection of Earth (E) and Solar Orbiter (O) from the source surface (SS) at 2.5 R⊙ to a height of 1.2 R⊙ above the photosphere. The solid black lines show the model neutral lines at 1.2 R⊙. Black contours indicate the magnetic field pressure at 1.2 R⊙ (∼140 Mm). The ballistic projection of the positions of Earth (green circle) and Solar Orbiter (red square) on the SS (crosses) and down to the solar wind source regions (circles) are calculated for the height R = 1.2 R⊙ and the in situ measured solar wind speed ±80 km s−1. Open magnetic field regions are shown in blue (negative) and green (positive). The area inside the dashed blue rectangular contains strong magnetic field regions, a negative open magnetic field area (sky blue), and two sections of a neutral line, one of which may be the CME source.
Current usage metrics show cumulative count of Article Views (full-text article views including HTML views, PDF and ePub downloads, according to the available data) and Abstracts Views on Vision4Press platform.
Data correspond to usage on the plateform after 2015. The current usage metrics is available 48-96 hours after online publication and is updated daily on week days.
Initial download of the metrics may take a while.