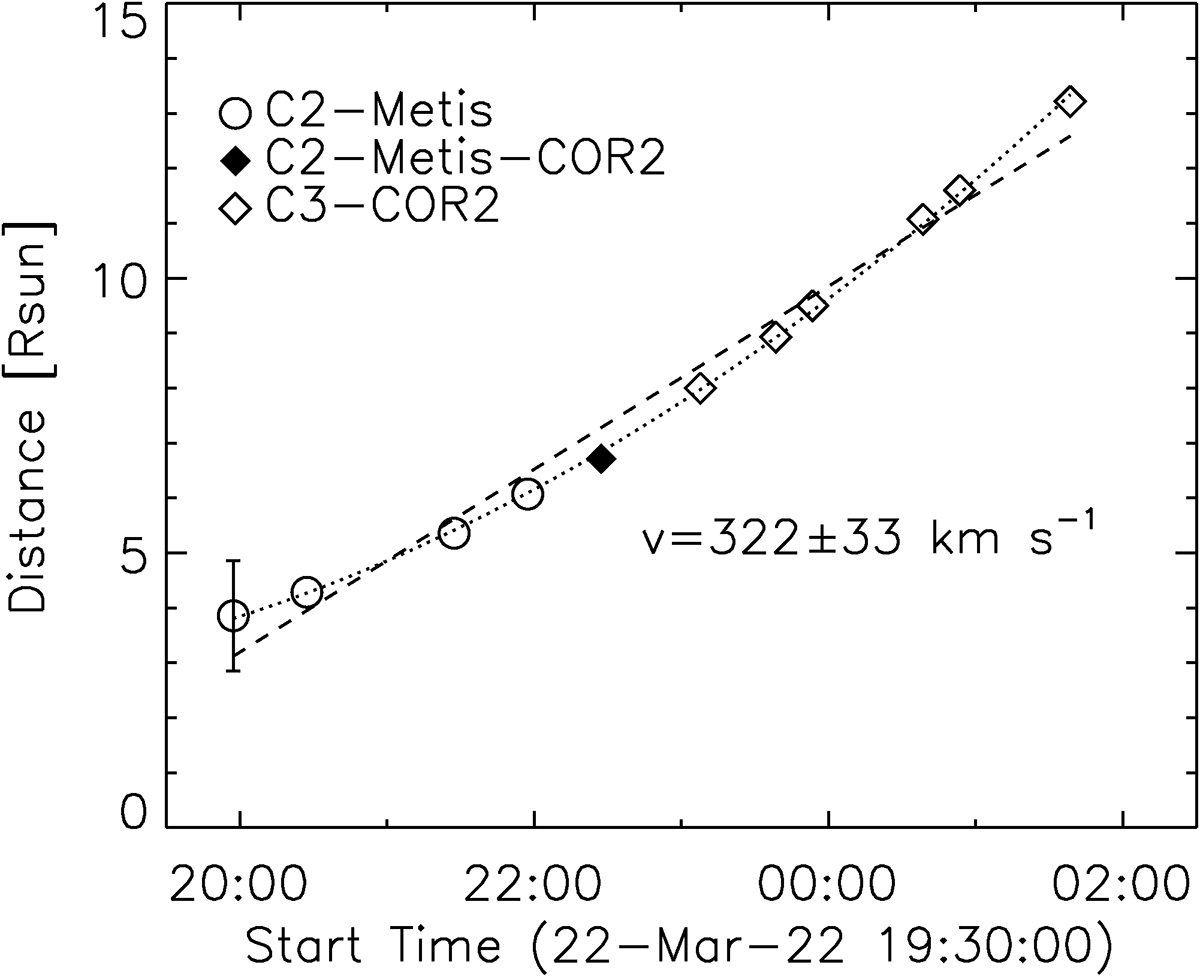
Fig. 7.
Download original image
Radial distance from the Sun centre of the CME front, obtained by the 3D reconstruction, as a function of time. The different symbols indicate the instruments that were used, as shown in the legend. The average speed for the whole period is obtained by a linear fit, which is indicated by the dashed line. The CME front acceleration is obtained by a quadratic fit, which is indicated by the dotted line (details are given in the main text). The error bar, corresponding to ±1 R⊙ for all points, is shown only for the first data point to allow a better visual inspection of the fitting.
Current usage metrics show cumulative count of Article Views (full-text article views including HTML views, PDF and ePub downloads, according to the available data) and Abstracts Views on Vision4Press platform.
Data correspond to usage on the plateform after 2015. The current usage metrics is available 48-96 hours after online publication and is updated daily on week days.
Initial download of the metrics may take a while.