Fig. 6.
Download original image
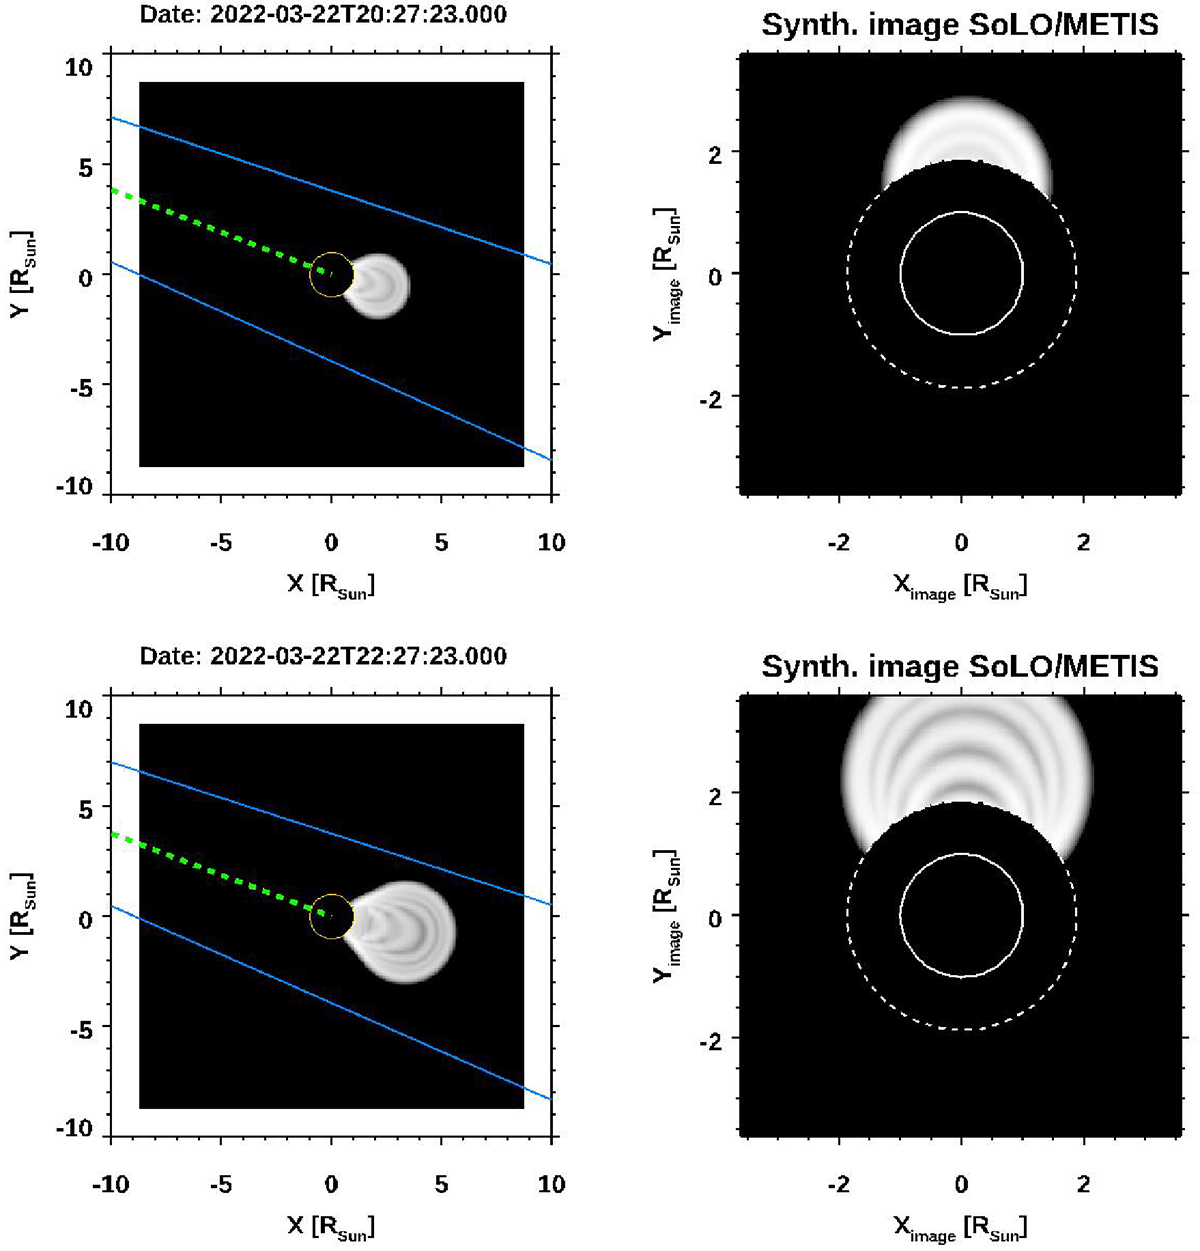
Synthetic images of the CME obtained by ray-tracing based on the GCS reconstruction parameters for two times corresponding to Fig. 3 (top) and to Fig. 4 (bottom). The left panels show the 3D reconstruction projected onto the solar equatorial plane: the dashed green line represents the Solar Orbiter look direction, and the blue lines delimit the Metis field of view. The right panels show the synthetic images corresponding to the Metis point of view.
Current usage metrics show cumulative count of Article Views (full-text article views including HTML views, PDF and ePub downloads, according to the available data) and Abstracts Views on Vision4Press platform.
Data correspond to usage on the plateform after 2015. The current usage metrics is available 48-96 hours after online publication and is updated daily on week days.
Initial download of the metrics may take a while.