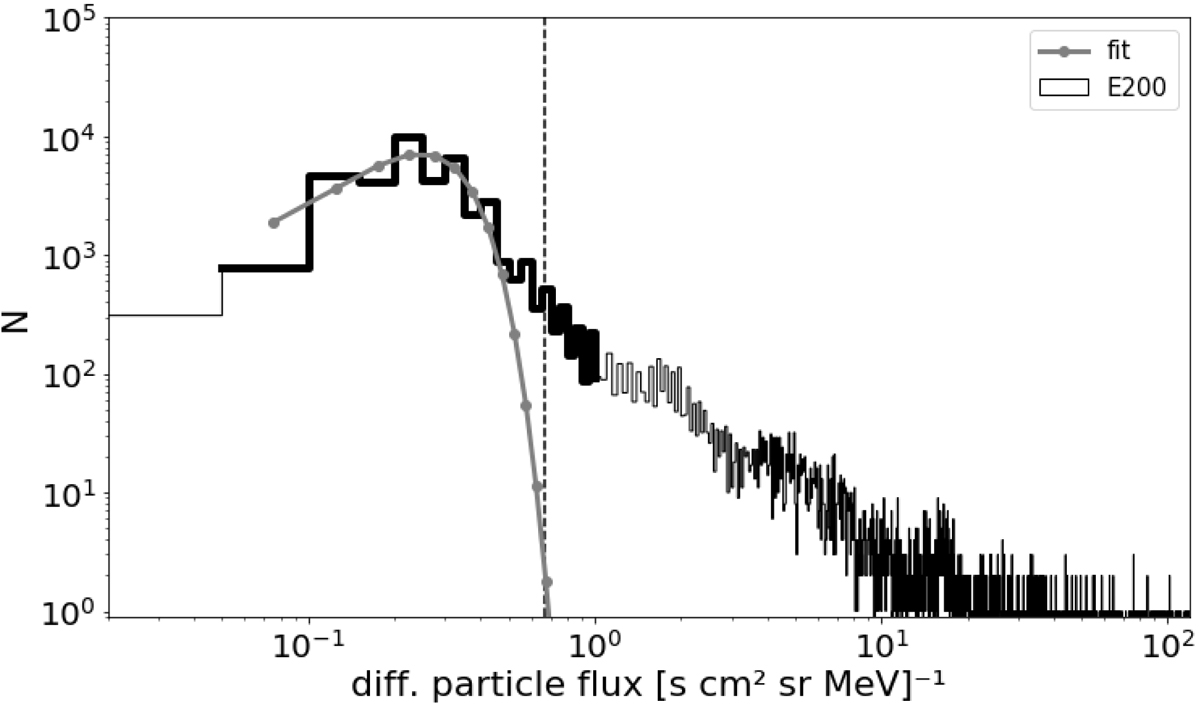
Fig. 7.
Download original image
Histogram of flux based on 10 min time resolution of the E200 channel over the entire mission. A highlighted area (thicker curve) of the histogram shows the predicted background energy range. The Gaussian fit can be seen as a curve in the energy range of the highlighted area. The thresholds found are shown as vertical lines.
Current usage metrics show cumulative count of Article Views (full-text article views including HTML views, PDF and ePub downloads, according to the available data) and Abstracts Views on Vision4Press platform.
Data correspond to usage on the plateform after 2015. The current usage metrics is available 48-96 hours after online publication and is updated daily on week days.
Initial download of the metrics may take a while.