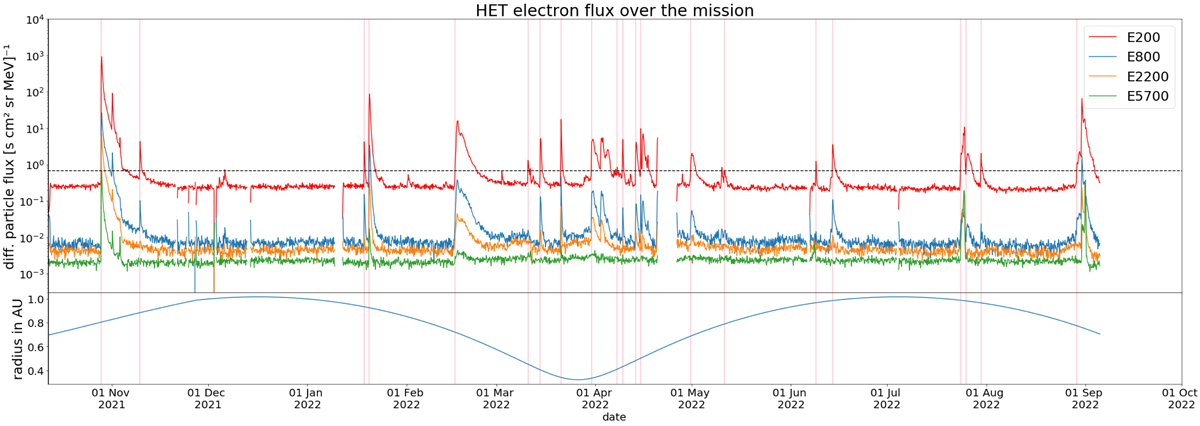
Fig. 6.
Download original image
Overview of the nominal electron flux over the time period from 12 October until 5 September in 3 h time resolution. The start time of each time period of enhanced flux that we find is highlighted with a pink vertical line. The lower panel shows the radial distance of Solar Orbiter to the Sun.
Current usage metrics show cumulative count of Article Views (full-text article views including HTML views, PDF and ePub downloads, according to the available data) and Abstracts Views on Vision4Press platform.
Data correspond to usage on the plateform after 2015. The current usage metrics is available 48-96 hours after online publication and is updated daily on week days.
Initial download of the metrics may take a while.