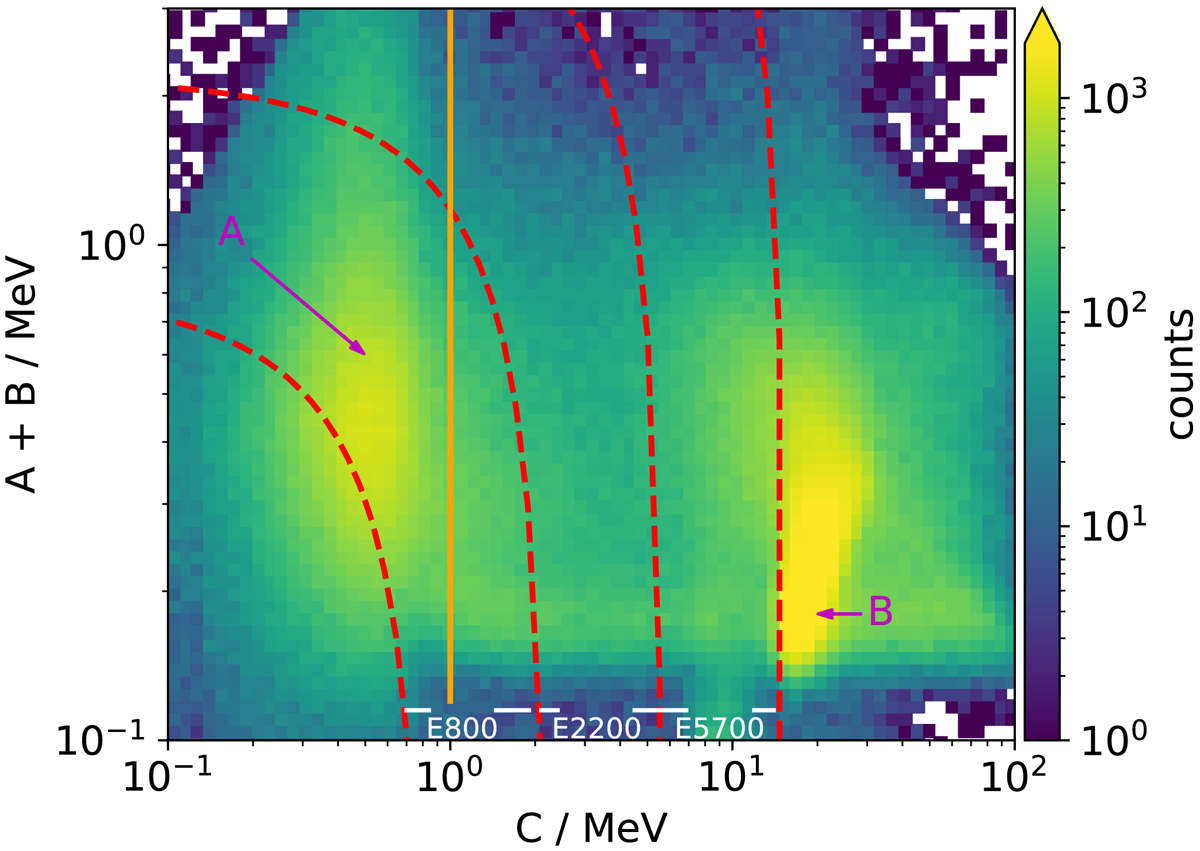
Fig. 4.
Download original image
PHA data of electrons stopping in C measured until October 2021. The red curves represent the energy ranges of the three electron channels (see Table 1) while the orange line indicates the absolute energy threshold in C introduced with a patch in October 2021. The populations A and B are discussed in the text.
Current usage metrics show cumulative count of Article Views (full-text article views including HTML views, PDF and ePub downloads, according to the available data) and Abstracts Views on Vision4Press platform.
Data correspond to usage on the plateform after 2015. The current usage metrics is available 48-96 hours after online publication and is updated daily on week days.
Initial download of the metrics may take a while.